1997issue C111-5
A spectral estimator that retunes indicators to the measured cycle
A measured dominant cycle can be treated as a live length parameter for indicators. The archive builds that measurement with a maximum-entropy estimator so the window can follow one cycle, rather than stretching a Fourier transform until the cycle is assumed to stay put.
- A measured cycle period is treated as an independent construction parameter so indicator lengths can be retuned to current conditions instead of remaining on fixed settings.
- Fourier analysis of a windowed price series is constrained to stationarity inside the window and to integer numbers of cycles, which leaves multi-day gaps among identifiable periods in a 64-day daily window.
- The maximum-entropy estimator compares the windowed series with a noise-driven tunable filter and can set data length dynamically to one dominant cycle.
- The same measurement also separates a cycle mode from a trend mode, because a cycle-only overlay is described as applicable only about 15 percent of the time.
A cycle period as a construction parameter
Indicator length is often left on a fixed setting. In this construction a measured cycle period is treated as an independent parameter, so those lengths can be retuned to current conditions.
The archive workflow is a lesson in how that measurement is built. Editorial comments below are labelled as such and are not part of the source.
Limits of a windowed Fourier spectrum
Fourier spectral analysis of a windowed price series is constrained in two ways. The series must be treated as stationary inside the window, and only integer numbers of cycles are identifiable. In a 64-day daily window those rules leave multi-day gaps among the periods that can be identified.
Lengthening the same construction to 256 daily observations can tighten period resolution near a 16-day cycle to about one day. That tighter grid still requires the cycle to remain consistent across the entire longer window.
Reading amplitude against period
A spectrum display plots amplitude against cycle period on a logarithmic decibel scale so cyclic components can be compared visually. Each 3 dB drop halves power, and a 20 dB span covers a 100-to-1 amplitude range.
On a theoretical 24-bar cycle, and on a March 1996 Treasury bond series, Fourier energy is spread across a wide band of periods. The intended cycle cannot be isolated from that transform.
Building the maximum-entropy estimator
Maximum entropy spectrum analysis is built as a comparison, not as a longer transform. The construction compares the windowed series with the output of a noise-driven tunable filter, then sweeps the filter's transfer response to recover the frequency content of the data.
Because that estimator is not bound by Fourier windowing or by integer-cycle rules, the data length can be set dynamically to one dominant cycle. Dominant cycle detection from the prior day sizes the current window.
MESA lock on a constructed 24-bar sinewave
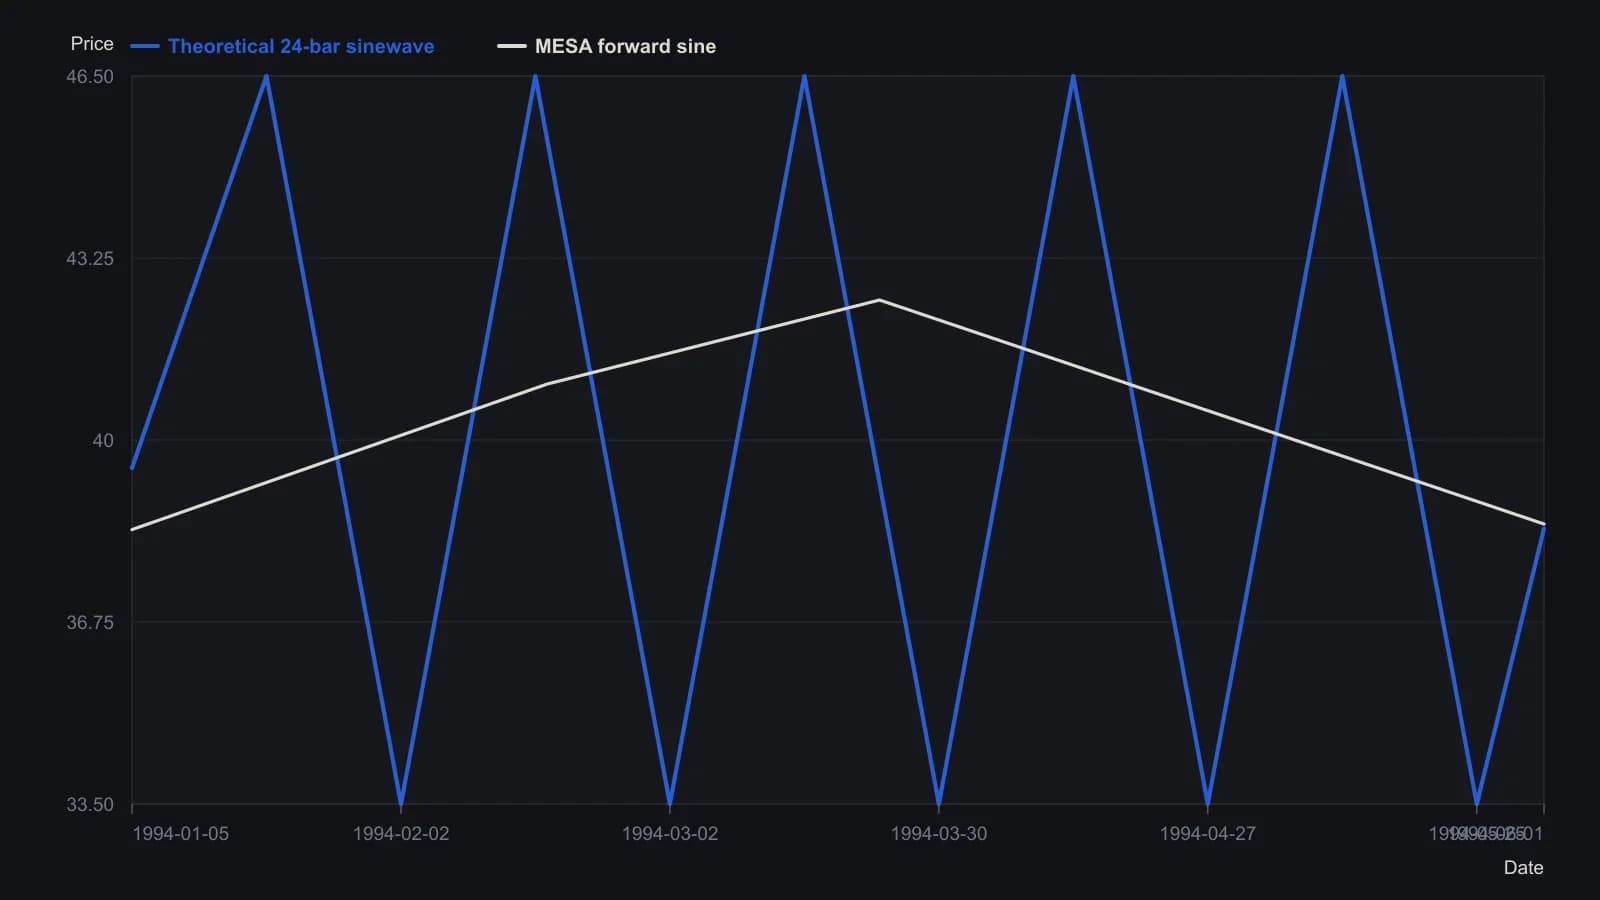
File sinewave.ttd is a constructed 24-bar cycle. Price path is digitized from the screenshot (vertical ticks are two points, so readings are to the nearest half point) except the last close 38.42, cycle 23 and phase 2.465, which are the software readout. The forward sine is only the short red arc drawn into June, not an extrapolated full cycle.
The same measurement for cycle and trend
The same cycle measurement is also used to separate a cycle mode from a trend mode. A cycle-only overlay is described as applicable only about 15 percent of the time, so the construction needs a trend-mode counterpart.
The source concludes that cycle-finder averaging and Fourier transforms lack the resolution and agility needed for dynamic indicator construction, while a high-resolution maximum-entropy estimate supplies both.
All readings on this track · 28 readings
- 1984Constructing maximum-entropy spectra for dominant-cycle forecasts
- 1984How to construct a maximum-entropy cycle model
- 1984Constructing a maximum-entropy forecast from a chosen lookback
- 1985Constructing period-locked half-cycle and full-cycle averages
- 1986Why Fourier windows limit dominant-cycle resolution
- 1987Assembling short-lookback maximum-entropy cycle forecasts
- 1988Why a fitted dominant cycle is not a forecast
- 1989Evaluating commodity cycle personalities with spectral histograms
- 1989Evaluating next-session cycle forecasts with stops
- 1989Constructing cycle-aged volatility trailing stops
- 1990A channel signal-to-noise gate for dominant-cycle forecasts
- 1990Year-over-year dominant cycle personality audit
- 1991Cyclic entry from a locked dominant-cycle phase
- 1992Stationarity states on synchronized futures spectral contours
- 1997Hidden horizon assumptions in dominant-cycle readings
- 1997When market cycles are absent more than present
- 1997A spectral estimator that retunes indicators to the measured cycle
- 2000Constructing a Hilbert dominant cycle and a maximum-entropy refinement
- 2000Switch trend and cycle indicators after a half-cycle dwell test
- 2000Constructing a dominant-cycle squelch trend filter
- 2000Phasor displays for dominant-cycle construction
- 2002Low-lag trendline from elliptic and dominant-cycle notches
- 2004Spectral peaks are mode diagnostics, not forecasts
- 2004Compressive last-stage oscillator construction
- 2013Constructing trend failure curves from qualified-trend transitions
- 2014Lookback range, a two-lag smoother, and next-bar fills
- 2014Constructing a MESA stochastic with roofing and SuperSmoother filters
- 2016Constructing spectral heatmaps for dominant market cycles