2000issue C091-3
Constructing a dominant-cycle squelch trend filter
A trend filter can be assembled by recovering a dominant-cycle period from ordered prices and comparing that period with a fixed squelch threshold. The gate labels trend mode or cycle mode from that single test rather than from analog frequency-band power.
- A trend episode is framed as a long-period, low-frequency cycle, while cycle mode has a shorter period and more complete oscillations inside the same observation window.
- Precision low-frequency filters were left unused because rounding error made them unstable, so the construction does not compare low-band and high-band filter power.
- The measured dominant-cycle length is compared with a fixed squelch threshold: a longer period is labelled trend mode and a shorter period is labelled cycle mode.
- A starting threshold of 20 bars, described as roughly a one-month cycle on daily sampling, can be lowered so trend-mode labels appear earlier, last longer, and can eventually cover nearly every bar.
Two readings of the same window
A trend episode can be framed as a long-period, low-frequency cycle. A cycle-mode episode has a shorter period and therefore more complete oscillations inside the same observation window.
Maximum entropy spectrum analysis is the modeling family in which this period-measurement construction sits. It is a spectral estimator for recovering cycle structure from ordered price, volume, or breadth observations. The quantity passed forward is the dominant cycle: the estimated length of the strongest cyclic component in an ordered price series.
Why analog band power was not the test
Precision low-frequency filters meant to isolate trend energy were found impractical in ordinary trading software because rounding error made those filters unstable. A direct comparison of low-band versus high-band filter power was not used.
Measured dominant-cycle length is treated as a proxy for where spectral activity sits. A long period implies most activity is at low frequency. A short period implies most activity is at higher frequency.
Assembling the trend filter as one gate
The trend filter is a constructed gate that assigns trend mode or cycle mode according to whether the measured dominant cycle is longer or shorter than a chosen threshold. The constructed test compares that measured period with a fixed bar-count cutoff, the squelch threshold, and labels the series trend mode when the period is longer than the threshold and cycle mode when it is shorter.
A threshold of 20 bars is offered as a starting value. That starting value is described as roughly a one-month cycle on daily sampling.
Hilbert dominant-cycle period vs 20-bar squelch
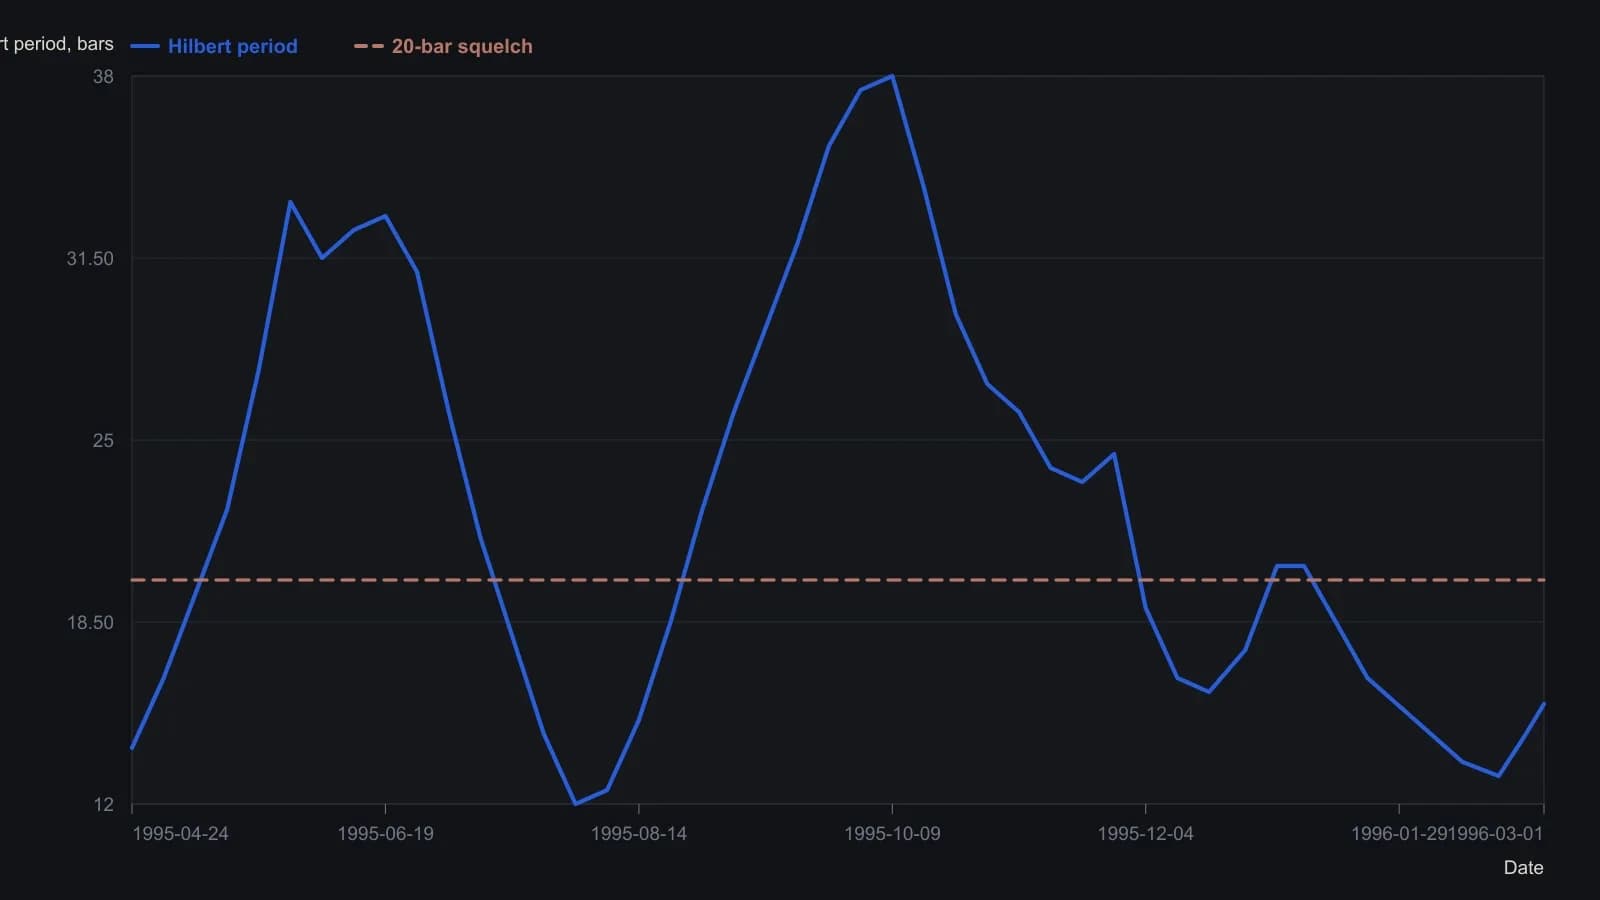
Daily bars from late April 1995 through 1 March 1996. Periods are approximate readings off the raster; the article fixes the Figure 1 squelch at 20 bars and prints the last Hilbert period as 15.57.
What the implementation adds
The implementation reuses an existing dominant-cycle period estimator. It adds only the threshold comparison plus a bar-color display that marks cycle mode when the period is below the threshold and trend mode when the period is above.
How a lower threshold opens the gate
Lowering the threshold from 20 bars to 15 bars causes trend-mode labels to appear earlier and to persist across a longer stretch of bars. Reducing the threshold still further can classify nearly every bar as trend mode, which the construction treats as equivalent to leaving the noise gate fully open.
All readings on this track · 28 readings
- 1984Constructing maximum-entropy spectra for dominant-cycle forecasts
- 1984How to construct a maximum-entropy cycle model
- 1984Constructing a maximum-entropy forecast from a chosen lookback
- 1985Constructing period-locked half-cycle and full-cycle averages
- 1986Why Fourier windows limit dominant-cycle resolution
- 1987Assembling short-lookback maximum-entropy cycle forecasts
- 1988Why a fitted dominant cycle is not a forecast
- 1989Evaluating commodity cycle personalities with spectral histograms
- 1989Evaluating next-session cycle forecasts with stops
- 1989Constructing cycle-aged volatility trailing stops
- 1990A channel signal-to-noise gate for dominant-cycle forecasts
- 1990Year-over-year dominant cycle personality audit
- 1991Cyclic entry from a locked dominant-cycle phase
- 1992Stationarity states on synchronized futures spectral contours
- 1997Hidden horizon assumptions in dominant-cycle readings
- 1997When market cycles are absent more than present
- 1997A spectral estimator that retunes indicators to the measured cycle
- 2000Constructing a Hilbert dominant cycle and a maximum-entropy refinement
- 2000Switch trend and cycle indicators after a half-cycle dwell test
- 2000Constructing a dominant-cycle squelch trend filter
- 2000Phasor displays for dominant-cycle construction
- 2002Low-lag trendline from elliptic and dominant-cycle notches
- 2004Spectral peaks are mode diagnostics, not forecasts
- 2004Compressive last-stage oscillator construction
- 2013Constructing trend failure curves from qualified-trend transitions
- 2014Lookback range, a two-lag smoother, and next-bar fills
- 2014Constructing a MESA stochastic with roofing and SuperSmoother filters
- 2016Constructing spectral heatmaps for dominant market cycles