2002issue C101-2
Trendline breaks, right shoulders, and trailing stops
A breakdown is studied after a significant advance over the prior few months, once a rising trendline has just failed. This case study walks the chart in three checks: confirm one rising line, test whether that line has truly broken, then ask whether the first bounce has failed again as a right shoulder. A trailing stop, applied from the start, keeps the last check falsifiable.
- A breakdown is a swift selloff studied after a significant advance over the prior few months, and the preferred chart is an uptrend that has just broken its rising trendline.
- A well-defined uptrend is a straight-line series of lows with stairstep advances, so a later trendline break stands out clearly.
- A head-and-shoulders breakdown is a sharp drop from a new high, a several-day sideways or upward recovery that forms a right shoulder, then a renewed decline through the trendline.
- A trailing stop applied from the start of the position keeps an early move with the idea from being fully reversed and lets a move against the idea be closed promptly.
Study a breakdown in three checks
Editorial framing: this article treats a breakdown as three checkpoints in order. First confirm that the prior advance can be drawn as one rising line. Then test whether that line has truly failed. Only then ask whether the first bounce has failed again as a right shoulder.
In the archive workflow, a breakdown is a swift selloff that is studied after a stock has already had a significant advance over the prior few months. The preferred chart condition is an uptrend that has just broken its rising trendline.
Confirm one rising line
A well-defined uptrend is described as a straight-line series of lows with stairstep advances, so a later trendline break stands out clearly. The trendline is the straight line under successive higher lows.
When an automatically fitted trendline is shown, a numeric trend-quality reading appears on the chart. A lower reading is described as a better-defined trend. Trend-quality is how tightly an advance has respected its rising line; a lower compactness reading is described as a cleaner trend.
Test whether the line has failed
A clear move through the trendline is treated as the first invalidation of the advance. A straight breakdown is defined as a move from a new high directly through the trendline.
A shallow dip just under a trendline after a new high is treated as incomplete. Price may still rally, form a right shoulder, and only later break more convincingly.
One stated scan rule looks for trendline violations greater than 1.6 percent. Scans limited to names with a prior multi-month runup can produce signal-free stretches of two or more weeks during general market advances.
NVIDIA daily closes through the trendline break
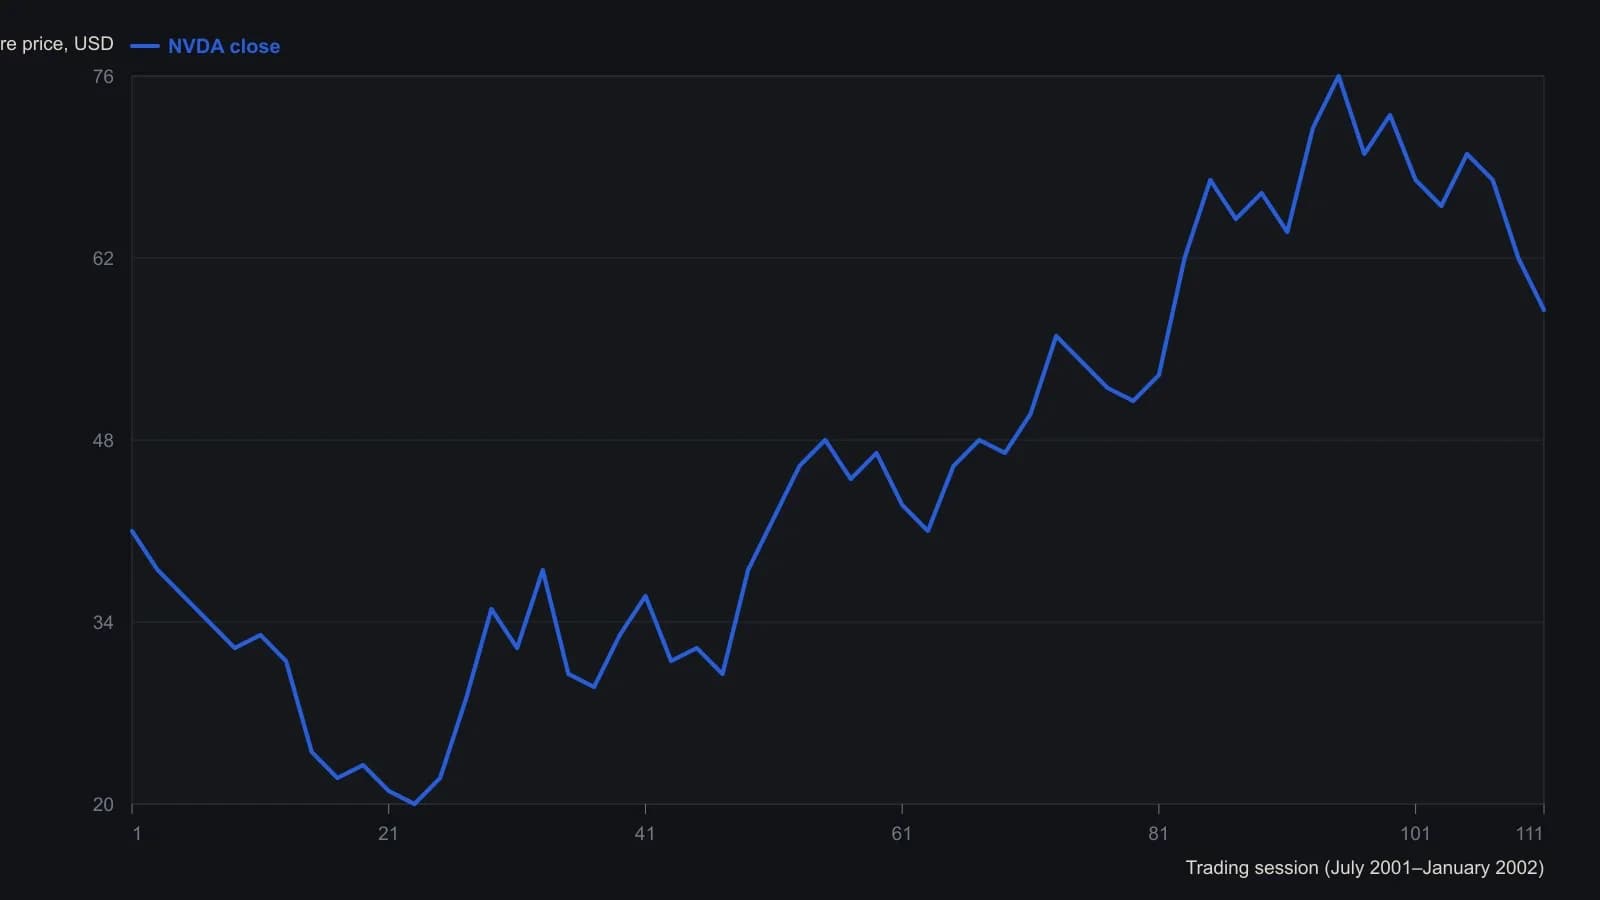
Yates treats this as a straight breakdown: a high-quality stairstep advance that goes from a new high directly through the rising line. Axis scale is the printed 10–80 dollar range for July 2001–January 2002. Values are visual readings of the bar chart, not tabulated prints.
Ask whether the bounce failed as a right shoulder
A head-and-shoulders breakdown is defined as a sharp drop from a new high, a several-day sideways or upward recovery that forms a right shoulder, then a renewed decline through the trendline. The right shoulder is the short pause or bounce after the first drop from a high, before price falls again.
The same scan rule can also flag a sharp selloff, a brief recovery, and a second decline. In this usage, head-and-shoulders is a selloff structure in which a drop from a peak is followed by a brief sideways or upward recovery that forms a right shoulder, then a second decline that leaves the prior uptrend.
Keep the last check falsifiable
A trailing stop is described as being applied from the start of the position so an early move with the idea is not fully reversed and a move against the idea can be closed promptly. The stop is set at the start of the idea and then advanced if price moves with the thesis, so a failed breakdown can be dropped quickly and an early gain is not fully given back.
Editorial note: treating the trailing stop as the classroom device that keeps the third checkpoint falsifiable, instead of turning the chart into a debate, is a TradersWeek interpretation. It is not an archive ranking of the three checks.
All readings on this track · 37 readings
- 1982Head and shoulders as a three-path completion test
- 1984Stock low clusters as a cycle baseline
- 1985Four-phase construction of the head-and-shoulders reversal
- 1989Volume-confirmed reversal patterns, stops, and measured objectives
- 1991The journal as one checklist for taken and skipped trades
- 1991Head and shoulders as a direction hypothesis
- 1991Candlestick body and shadow construction with three-Buddha peaks
- 1992A three-count drill that binds candlesticks, head and shoulders, and entry rules
- 1997Constructing bump and run reversal channels
- 1998Testing reversal formations in bond futures
- 1999Construction first: extra shoulders, the neckline, and the diamond test
- 1999Dead-cat bounce, rollover, and failed reversals
- 1999Evaluating time gaps in bond reversal patterns
- 2000Constructing head and shoulders and double reversal patterns
- 2001Constructing broadening and complex bottoms
- 2001Constructing a slanted head-and-shoulders when the chart is tilted
- 2002Head and shoulders with dominant-cycle timing
- 2002Trendline breaks, right shoulders, and trailing stops
- 2003Confirmation tests for bearish top patterns
- 2003Commodity top hypotheses on a dollar rebound
- 2003A head-and-shoulders test during a bear rally
- 2004Pattern breakouts need a primary-trend filter
- 2004Reading candlestick closes on trendline and neckline tests
- 2004Candle diagnosis needs Western targets and stops
- 2004Head-and-shoulders neckline construction
- 2005A familiar chart condition is a hypothesis, not a completed decision
- 2005A 50-day ceiling and a rising-floor stalemate
- 2006A complete trading plan from philosophy to checklist
- 2006Thin-market head and shoulders with two averages and MACD confirmation
- 2010Head and shoulders as a playback-tested setup
- 2011Turning a head-and-shoulders outline into a breakout hypothesis
- 2011Volume-confirmed head and shoulders on AIG and Citigroup in 2007
- 2013Constructing head-and-shoulders milestone points
- 2013Head-and-shoulders geometry versus the filter stack
- 2013Algorithmic head-and-shoulders construction
- 2018International relative strength as a double-top case study
- 2019Structure invalidation before comfort-stops