2005issue C061-2
A 50-day ceiling and a rising-floor stalemate
The daily S&P 500 was described as oscillating between a rising trendline and the 50-day moving average, so a long thesis was withheld. After both rails failed, the next support map came from an older congestion zone and a head-and-shoulders measured zone, not from the oil story.
- While price sat between a rising-trendline floor and a 50-day moving-average ceiling, any long thesis waited on a break above the average.
- After the floor broke and price stood below the average, that average became a directional-filter and new long exposure was taken off the table.
- A modest decline in crude oil, even near the watched 52 area, did not produce the expected equity lift.
- The next daily support near 1090-1100 was a prior congestion-zone that overlapped a head-and-shoulders measured-zone near 1100-1110.
A trapped range on the daily chart
The daily S&P 500 was described as oscillating between an upward-sloping trendline treated as support and a 50-day moving average treated as resistance. That rising-trendline had been tested three times. Support-resistance in this stretch was the pair of rails: the slope under successive daily lows, and the moving-average acting as a ceiling.
Any long thesis was deferred until a break above the 50-day average. Until that break, the location of price between the two rails was treated as a reason to wait rather than as a finished directional view.
Daily S&P 500 between a rising trendline and the 50-day average
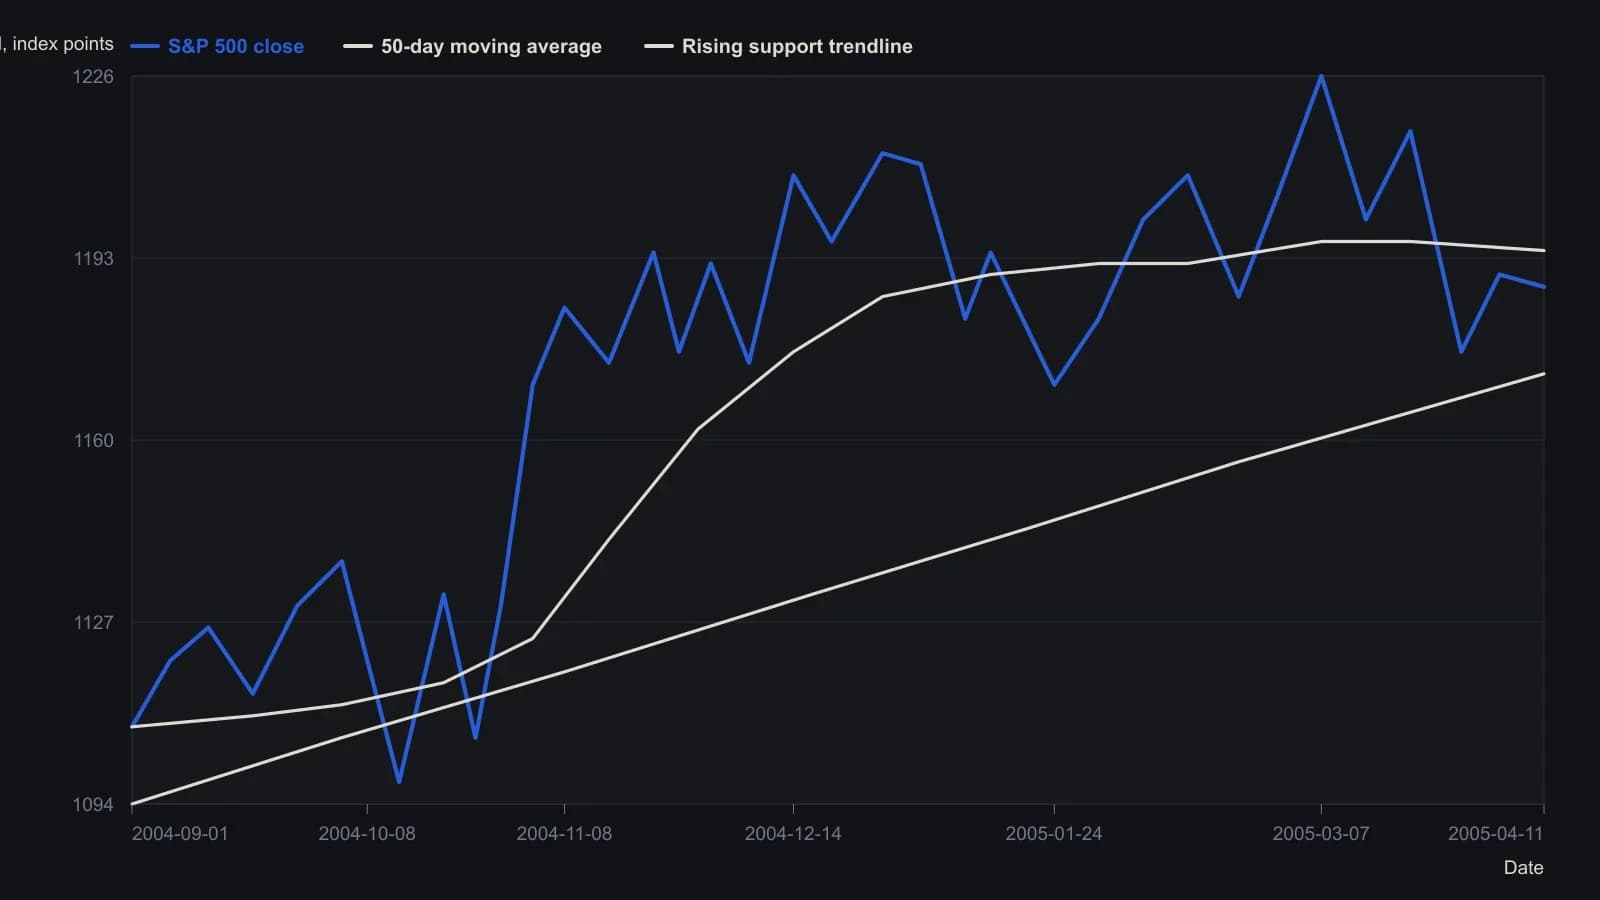
Digitized from the daily eSignal raster. Swing points are approximate to a few index points; only the terminal cash close and 50-day value are taken from the printed labels. The rising rail is the straight support line drawn on the same chart, sampled along the segment that is actually visible.
Oil did not reset the map
A modest decline in crude oil did not produce the expected equity lift. Crude near 52 had been the level watched before looking for stocks to turn higher.
Editorial note: that oil story is not a substitute for the chart map once the two rails fail.
Both rails fail
Price later lost the rising support and stood below the 50-day average. The case then treated new long exposure as off the table and treated the e-mini as a short-side candidate.
At that point the moving-average worked as a directional-filter. Location versus the 50-day average gated whether new long exposure was even under consideration.
Session record after the break
Intraday records for 14 April and 15 April showed repeated downside bursts, steepest near each close. Disappointing IBM earnings were listed among the session influences. No fills were recorded on those days.
On 18 April a short was opened at 1148 and covered at 1145 after the session was judged unlikely to reverse.
Next support from congestion and a topping map
After the breakdown, the next daily support zone was placed near 1090-1100. That band matched a congestion-zone, a cluster of price bars from October 2004.
A possible head-and-shoulders top was mapped with a measured-zone near 1100-1110. The implied downside area overlapped the same 1090-1100 support band, so the topping map and the older congestion were checked against each other rather than treated as separate stories.
Editorial reading: once the waiting room failed, the checkable next-support map was that overlap, not a preferred oil narrative.
All readings on this track · 37 readings
- 1982Head and shoulders as a three-path completion test
- 1984Stock low clusters as a cycle baseline
- 1985Four-phase construction of the head-and-shoulders reversal
- 1989Volume-confirmed reversal patterns, stops, and measured objectives
- 1991The journal as one checklist for taken and skipped trades
- 1991Head and shoulders as a direction hypothesis
- 1991Candlestick body and shadow construction with three-Buddha peaks
- 1992A three-count drill that binds candlesticks, head and shoulders, and entry rules
- 1997Constructing bump and run reversal channels
- 1998Testing reversal formations in bond futures
- 1999Construction first: extra shoulders, the neckline, and the diamond test
- 1999Dead-cat bounce, rollover, and failed reversals
- 1999Evaluating time gaps in bond reversal patterns
- 2000Constructing head and shoulders and double reversal patterns
- 2001Constructing broadening and complex bottoms
- 2001Constructing a slanted head-and-shoulders when the chart is tilted
- 2002Head and shoulders with dominant-cycle timing
- 2002Trendline breaks, right shoulders, and trailing stops
- 2003Confirmation tests for bearish top patterns
- 2003Commodity top hypotheses on a dollar rebound
- 2003A head-and-shoulders test during a bear rally
- 2004Pattern breakouts need a primary-trend filter
- 2004Reading candlestick closes on trendline and neckline tests
- 2004Candle diagnosis needs Western targets and stops
- 2004Head-and-shoulders neckline construction
- 2005A familiar chart condition is a hypothesis, not a completed decision
- 2005A 50-day ceiling and a rising-floor stalemate
- 2006A complete trading plan from philosophy to checklist
- 2006Thin-market head and shoulders with two averages and MACD confirmation
- 2010Head and shoulders as a playback-tested setup
- 2011Turning a head-and-shoulders outline into a breakout hypothesis
- 2011Volume-confirmed head and shoulders on AIG and Citigroup in 2007
- 2013Constructing head-and-shoulders milestone points
- 2013Head-and-shoulders geometry versus the filter stack
- 2013Algorithmic head-and-shoulders construction
- 2018International relative strength as a double-top case study
- 2019Structure invalidation before comfort-stops