2006issue C041-3
Thin-market head and shoulders with two averages and MACD confirmation
The 2005 case material treats classic chart conditions as usable on low-turnover emerging-market shares, against the then-common view that only fundamentals could be applied there. Editorial reading: write the idea as a chart-structure hypothesis, keep it alive only while a fast and a slow exponential average stay aligned, and treat a matching MACD zero-line event as confirmation of the break rather than a forecast of how far price will travel.
- The 2005 case material treats classic chart conditions as usable on low-turnover emerging-market shares, against the then-common view that only fundamentals could be applied there.
- A late-2004 long hypothesis had to break a price channel, a prior minor peak, and both the 21-day and 100-day exponential averages together. A move back through the fast average was the short-term exit, and a break of the slow average tested the larger top.
- Editorial reading: keep the hypothesis alive only while the fast and slow exponential averages stay aligned, and treat a matching MACD zero-line event as confirmation of the break rather than a forecast of how far price will travel.
- On individual low-attention names, moving averages, MACD, and basic patterns including head-and-shoulders were preferred. Fibonacci and Elliott-wave methods were described as less practical until the object of study was a broader market index.
Classic structure on low-turnover shares
The 2005 case material treats classic chart conditions as usable on low-turnover emerging-market shares. That stance ran against the then-common view that only fundamentals could be applied there.
A thin-market listing is one whose turnover is low enough that many participants assume charts cannot reflect crowd behavior and therefore skip structural tests.
A fast average to trail, a slow average to hold
The working rule set used a 21-period exponential average to track the short-term trend and a 100-period exponential average as the level that should hold if the larger trend remained intact.
The exponential moving average was a recursively weighted average of recent closes used as a regime filter rather than a price target. The fast average, the 21-period line, judged whether the short-term swing was still intact and, while it was, served as a trailing exit. The slow average, the 100-period line, was the larger-trend hold: a pullback that stayed above it remained consistent with the prior regime, and a break questioned that regime.
Three concurrent breaks on a chemical share
One late-2004 long hypothesis on a Bulgarian chemical share required three concurrent breaks: the 2004 price channel, a prior minor peak, and both the 21-day and 100-day exponential moving averages.
After that advance, a move back through the 21-day exponential average was defined as a short-term exit. A drop under the 100-day average near 45 local-currency units was the test of a larger top.
An uptrend shift, then a daily head and shoulders
On a thinly traded Bulgarian holding company, a move above the 100-day exponential average and above 0.4 local-currency units was treated as a shift into an uptrend. The 21-day average was used as a trailing stop while price stayed above it.
A later daily head-and-shoulders on the same holding company was treated as confirmed below 3.3 local-currency units. A head-and-shoulders is a three-swing reversal whose neckline break is treated as the confirmation that the prior trend has failed. The neckline is the line joining the two shoulders. A decisive break is the pattern trigger, and a failed retest from the far side keeps the new direction intact.
A failed neckline retest that stayed under the 100-day average kept the short-term bias down. A break under 3.0 pointed toward a measured zone near 2.5 to 2.4.
IHLBL daily: head-and-shoulders after the EMA-led uptrend
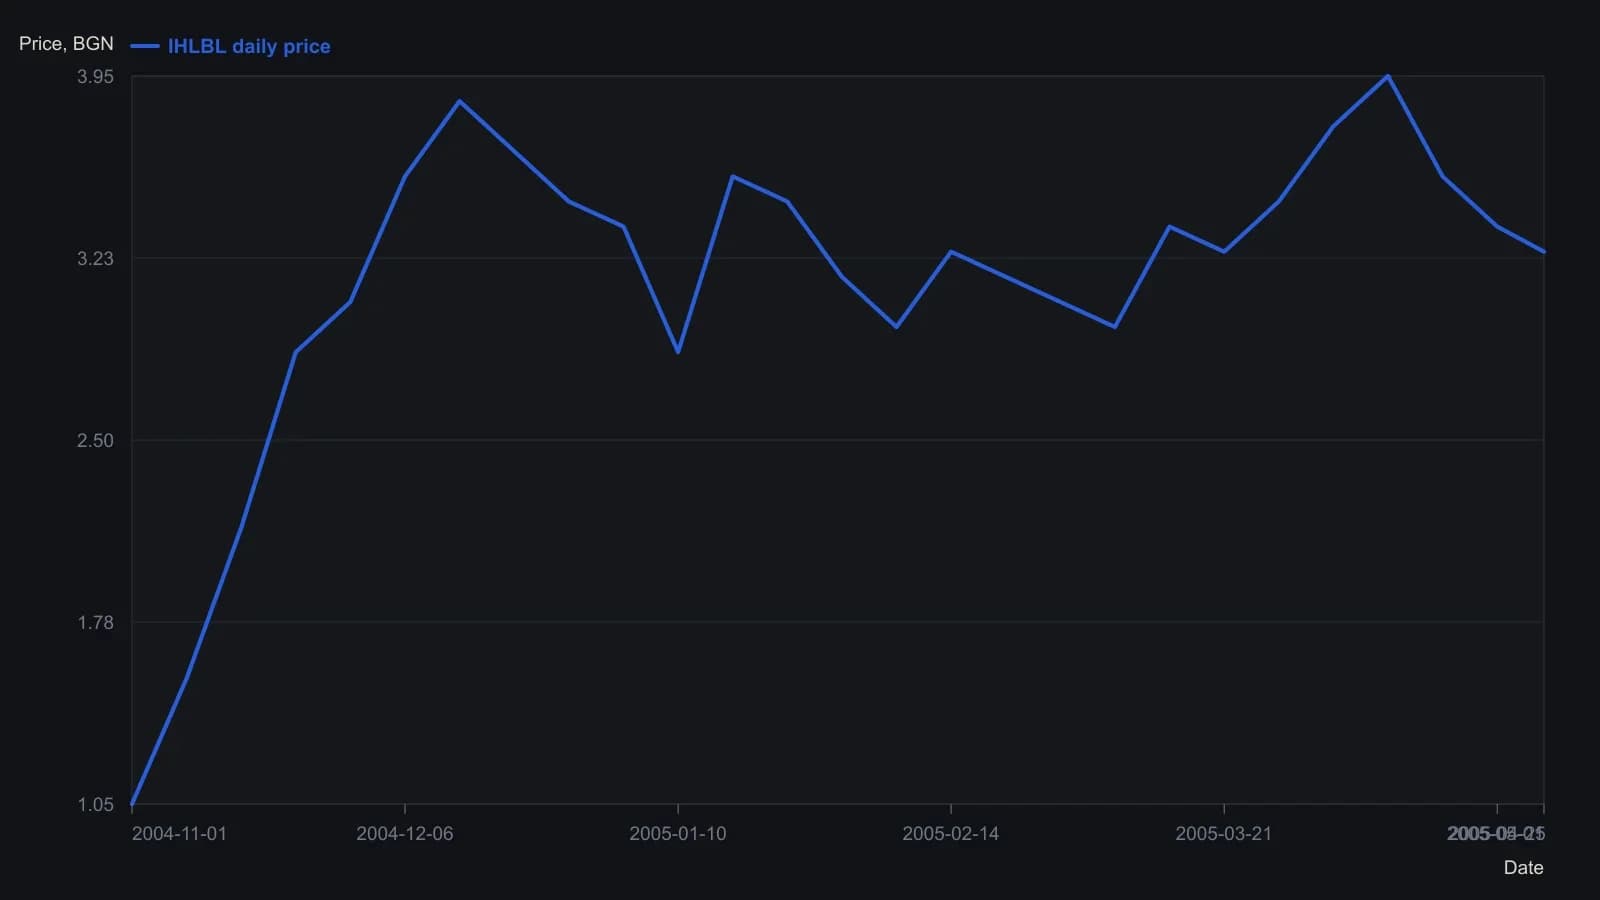
Y-values are approximate closes read from the raster against the article's printed scale (BGN 1.0, 2.4, 3.0, 3.3, 4.1). The source used a 21-day EMA as a trail and a 100-day EMA as the larger-trend hold; neither average is a separate numeric series here.
A weekly triangle matched by MACD
On a weekly Russian automaker chart, an approximately 18-month symmetrical triangle in price was described as matched by a triangle in MACD. The price break coincided with MACD crossing above zero and a prior oscillator peak.
A symmetrical triangle is a multi-month coil of lower highs and higher lows whose upside resolution is treated as a trend hypothesis only when a confirming oscillator event occurs with it. MACD is an oscillator of the gap between two exponential averages, used to confirm a contracting price range when the oscillator also contracts and then crosses zero with a prior peak.
Simpler tools on low-attention names
For individual low-attention names, simpler tools were preferred: moving averages, MACD, and basic patterns including head-and-shoulders. Fibonacci and Elliott-wave methods were described as less practical until the object of study was a broader market index.
All readings on this track · 37 readings
- 1982Head and shoulders as a three-path completion test
- 1984Stock low clusters as a cycle baseline
- 1985Four-phase construction of the head-and-shoulders reversal
- 1989Volume-confirmed reversal patterns, stops, and measured objectives
- 1991The journal as one checklist for taken and skipped trades
- 1991Head and shoulders as a direction hypothesis
- 1991Candlestick body and shadow construction with three-Buddha peaks
- 1992A three-count drill that binds candlesticks, head and shoulders, and entry rules
- 1997Constructing bump and run reversal channels
- 1998Testing reversal formations in bond futures
- 1999Construction first: extra shoulders, the neckline, and the diamond test
- 1999Dead-cat bounce, rollover, and failed reversals
- 1999Evaluating time gaps in bond reversal patterns
- 2000Constructing head and shoulders and double reversal patterns
- 2001Constructing broadening and complex bottoms
- 2001Constructing a slanted head-and-shoulders when the chart is tilted
- 2002Head and shoulders with dominant-cycle timing
- 2002Trendline breaks, right shoulders, and trailing stops
- 2003Confirmation tests for bearish top patterns
- 2003Commodity top hypotheses on a dollar rebound
- 2003A head-and-shoulders test during a bear rally
- 2004Pattern breakouts need a primary-trend filter
- 2004Reading candlestick closes on trendline and neckline tests
- 2004Candle diagnosis needs Western targets and stops
- 2004Head-and-shoulders neckline construction
- 2005A familiar chart condition is a hypothesis, not a completed decision
- 2005A 50-day ceiling and a rising-floor stalemate
- 2006A complete trading plan from philosophy to checklist
- 2006Thin-market head and shoulders with two averages and MACD confirmation
- 2010Head and shoulders as a playback-tested setup
- 2011Turning a head-and-shoulders outline into a breakout hypothesis
- 2011Volume-confirmed head and shoulders on AIG and Citigroup in 2007
- 2013Constructing head-and-shoulders milestone points
- 2013Head-and-shoulders geometry versus the filter stack
- 2013Algorithmic head-and-shoulders construction
- 2018International relative strength as a double-top case study
- 2019Structure invalidation before comfort-stops