2004issue C041-5
Pattern breakouts need a primary-trend filter
A completed head-and-shoulders or double formation is a breakout hypothesis with a depth-based measured-move. That hypothesis stays incomplete until a primary-trend filter says the setup is aligned with the sector primary trend.
- A completed formation is a breakout hypothesis whose first target is the pattern depth projected in the breakout direction, and the same measuring idea is used from daily charts to other time frames.
- Isolated breakouts are incomplete without a primary-trend filter that prefers bullish completions in rising markets and bearish completions in falling markets.
- In the historical workflow, protrend-signals more often reached their measured-move targets and typically traveled farther than contratrend-signals.
- A well-drawn outline is not enough. Waiting is counted in pattern-length, and a slower trend-context reading decides whether the same silhouette is more or less trustworthy.
A completed pattern is a breakout hypothesis
A completed formation is treated as a breakout hypothesis. The first target is a measured-move: the depth of the finished outline, projected in the breakout direction. The same measuring idea is said to apply from daily charts to other time frames.
Head-and-shoulders is a multi-peak or multi-trough reversal outline whose neckline break is the completion signal and the starting point for that depth-based target. Double-top-bottom is a two-peak or two-trough reversal outline whose second failure and breakout play the same role.
Older ideas inside the outline
Pattern analysis is presented as a bundle of older technical ideas: successive peaks and troughs, trendline support and resistance, and the rule that a larger formation carries more weight than a smaller one.
Editorial reading: those ingredients are why a tidy silhouette is not the object of study. The object is a repeatable condition that can be measured after the break.
How the historical workflow measured reach
Head-and-shoulders and double tops and bottoms were scored after the fact across four equity sectors over 1982 to 2003. Each sector was first split into primary rising and falling periods.
Post-breakout price paths were measured in units of pattern-length, written as L, with observation extending to a maximum of 5L. A 50-day head-and-shoulders bottom is the worked example of L. Pattern-length is the time needed for a formation to complete, and it is the unit for how long after the breakout a measured-move is given to develop.
Among 1,748 bottom formations, the share of cases that met or exceeded the measured-move target was tabulated, including outcomes well above 100 percent of the projected distance.
Protrend and contratrend paths
A protrend-signal is a breakout that points the same way as the sector primary trend, such as a bullish completion in a rising market or a bearish completion in a falling market. A contratrend-signal points against that trend, such as a bullish completion during a declining market.
Aligned signals more often reached their targets and typically traveled farther than opposing signals. That gap was shown for both bullish bottoms and bearish sells, and it was illustrated with 496 bottoms taken against a declining primary trend.
Primary-trend price path, February 2002–December 2003
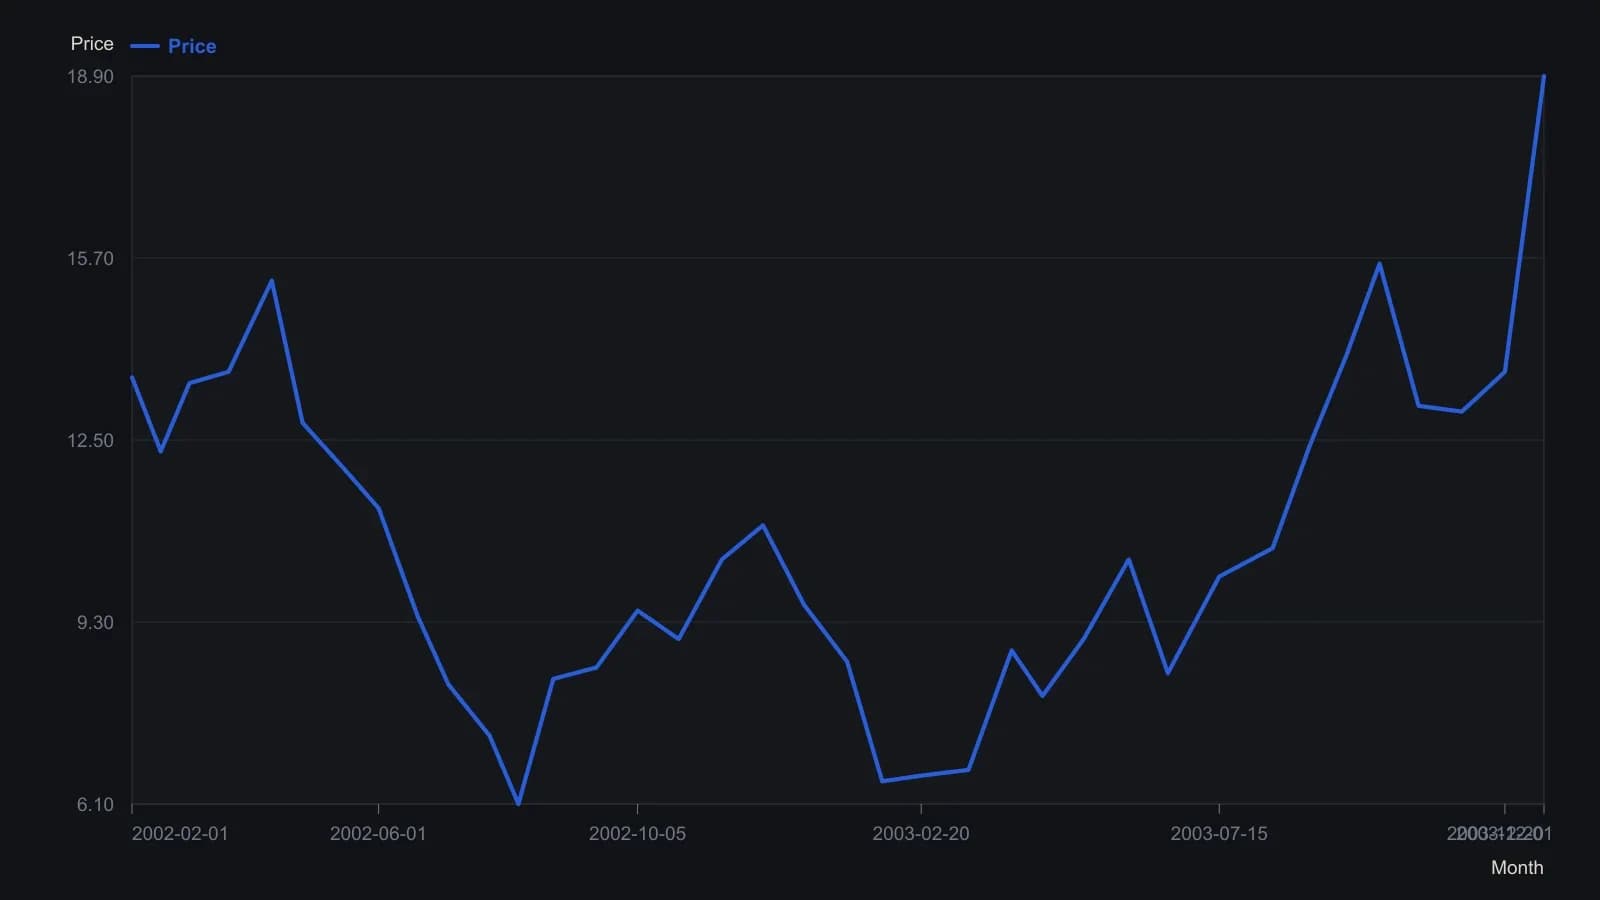
Digitized from the raster. The vertical scale is labeled every four points, so readings are approximate to about three-tenths of a point and are not official prints.
A neat outline is not enough
A well-drawn head-and-shoulders outline is not treated as sufficient on its own. A slower trend-context reading, such as a long-term oscillator below zero and rising versus already bullish, is used to decide whether the same outline is more or less trustworthy.
What the archive does not claim
The source does not claim that every aligned breakout becomes profitable or that price advances in a straight line. It only argues that waiting up to 5L after aligned head-and-shoulders and double-bottom buys in a rising sector improves the chance of reaching the measured objective, while still leaving open which names stop near 100 percent and which exceed it.
Editorial reading: judge these formations by reach, waiting time, and trend context rather than by how neat the outline looks. Read the measured-move only after a primary-trend filter has sorted the breakout as a protrend-signal or a contratrend-signal.
All readings on this track · 37 readings
- 1982Head and shoulders as a three-path completion test
- 1984Stock low clusters as a cycle baseline
- 1985Four-phase construction of the head-and-shoulders reversal
- 1989Volume-confirmed reversal patterns, stops, and measured objectives
- 1991The journal as one checklist for taken and skipped trades
- 1991Head and shoulders as a direction hypothesis
- 1991Candlestick body and shadow construction with three-Buddha peaks
- 1992A three-count drill that binds candlesticks, head and shoulders, and entry rules
- 1997Constructing bump and run reversal channels
- 1998Testing reversal formations in bond futures
- 1999Construction first: extra shoulders, the neckline, and the diamond test
- 1999Dead-cat bounce, rollover, and failed reversals
- 1999Evaluating time gaps in bond reversal patterns
- 2000Constructing head and shoulders and double reversal patterns
- 2001Constructing broadening and complex bottoms
- 2001Constructing a slanted head-and-shoulders when the chart is tilted
- 2002Head and shoulders with dominant-cycle timing
- 2002Trendline breaks, right shoulders, and trailing stops
- 2003Confirmation tests for bearish top patterns
- 2003Commodity top hypotheses on a dollar rebound
- 2003A head-and-shoulders test during a bear rally
- 2004Pattern breakouts need a primary-trend filter
- 2004Reading candlestick closes on trendline and neckline tests
- 2004Candle diagnosis needs Western targets and stops
- 2004Head-and-shoulders neckline construction
- 2005A familiar chart condition is a hypothesis, not a completed decision
- 2005A 50-day ceiling and a rising-floor stalemate
- 2006A complete trading plan from philosophy to checklist
- 2006Thin-market head and shoulders with two averages and MACD confirmation
- 2010Head and shoulders as a playback-tested setup
- 2011Turning a head-and-shoulders outline into a breakout hypothesis
- 2011Volume-confirmed head and shoulders on AIG and Citigroup in 2007
- 2013Constructing head-and-shoulders milestone points
- 2013Head-and-shoulders geometry versus the filter stack
- 2013Algorithmic head-and-shoulders construction
- 2018International relative strength as a double-top case study
- 2019Structure invalidation before comfort-stops