1991issue C021-6
Head and shoulders as a direction hypothesis
A completed inverse-head-and-shoulders on a major industrial average was presented as a near-mirror of a midsummer distribution. The geometry is allowed to hypothesize a change in supply or demand, not to name how far price must travel.
- A completed head-and-shoulders is a chart condition that hypothesizes a change of trend rather than a precise destination.
- The inverse-head-and-shoulders was read as reaccumulation after a decline and as a near-mirror of the earlier distribution.
- Pattern-measurement was treated as uncommon, typically a floor, and not a license to print a long-horizon target.
- Chart work was limited to trend-health and whether direction might be changing, not to guessing a price level.
A completed inverse-head-and-shoulders on a major industrial average was presented as a reversal structure implying a subsequent advance. That inverse structure was described as a near-mirror of a head-and-shoulders distribution that had formed at a midsummer peak.
The earlier topping process was distribution, a period in which supply overtakes demand, and it was tied to a summer head-and-shoulders breakdown. The later base was reaccumulation, a basing process after a decline in which demand rebuilds, and it was tied to the completed inverse-head-and-shoulders.
What the geometry may claim
In this case a head-and-shoulders is a three-swing reversal in which a central extreme is flanked by two lesser swings. It is used as a completed chart condition that hypothesizes a change of trend rather than a precise destination.
An inverse-head-and-shoulders is the upside counterpart of a topping head-and-shoulders: a central low flanked by two higher lows, read as reaccumulation or reversal after a decline.
Pattern-measurement as a rare floor
A rounded measured zone of 2650-2700 was attached to the reverse head-and-shoulders, with the caveat that legitimate reaccumulation or distribution patterns, and therefore usable measurements, appear only rarely.
Pattern-measurement is a minimum distance taken from the height of the head to the neckline. It is treated here as uncommon, typically a floor, and not a license to print a long-horizon target.
The topping pattern that preceded the July-to-October decline was said not to have contained enough information to imply a drop to the 2344 intraday low. It was treated only as evidence that the market was in trouble.
Trend-health instead of printed targets
Chart work was limited to judging whether an advance or decline was still healthy and whether direction might be changing. Printed long-horizon numerical targets were rejected as something no method can produce.
Trend-health asks whether an existing advance or decline remains internally consistent in breadth, momentum, and leadership, independent of any guessed price level.
The last advance toward 3000 was judged a low-quality rally because momentum, breadth, and leadership were weak, with oil strength coming at the expense of almost every other group.
Discounting and participant behavior
A price chart was defined as the record of what participants think fundamentals are once they commit capital, so a constructive pattern was treated as stronger when an independent fundamental view agreed.
Discounting is the observation that price structure can turn before the economic narrative does, so a chart can improve while reports still look bleak.
Program trading was described as able to fire only after a trend already exists and then to exaggerate that trend, leaving classic reversal geometry such as head-and-shoulders intact as a reading of participant behavior.
Dow Jones Industrial Average, January–November 1990
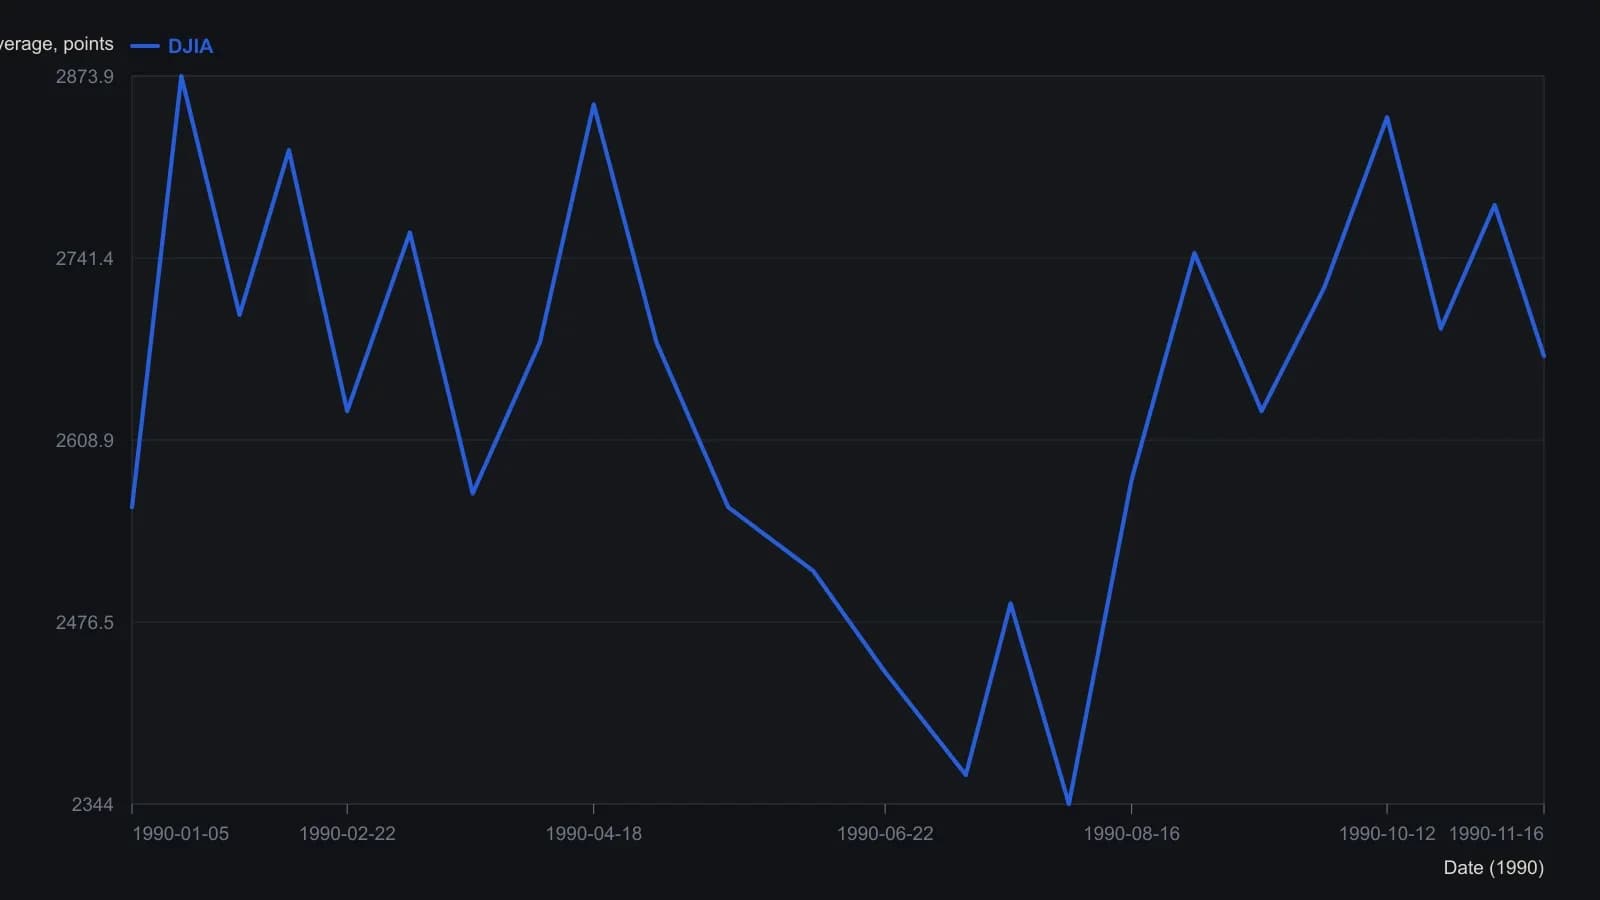
Unlabeled sessions are approximate raster readings, rounded to 10 points. Prints written on the figure keep the labeled tenths. Bloch treated the 2650–2700 projection as a rare minimum, not a target.
All readings on this track · 37 readings
- 1982Head and shoulders as a three-path completion test
- 1984Stock low clusters as a cycle baseline
- 1985Four-phase construction of the head-and-shoulders reversal
- 1989Volume-confirmed reversal patterns, stops, and measured objectives
- 1991The journal as one checklist for taken and skipped trades
- 1991Head and shoulders as a direction hypothesis
- 1991Candlestick body and shadow construction with three-Buddha peaks
- 1992A three-count drill that binds candlesticks, head and shoulders, and entry rules
- 1997Constructing bump and run reversal channels
- 1998Testing reversal formations in bond futures
- 1999Construction first: extra shoulders, the neckline, and the diamond test
- 1999Dead-cat bounce, rollover, and failed reversals
- 1999Evaluating time gaps in bond reversal patterns
- 2000Constructing head and shoulders and double reversal patterns
- 2001Constructing broadening and complex bottoms
- 2001Constructing a slanted head-and-shoulders when the chart is tilted
- 2002Head and shoulders with dominant-cycle timing
- 2002Trendline breaks, right shoulders, and trailing stops
- 2003Confirmation tests for bearish top patterns
- 2003Commodity top hypotheses on a dollar rebound
- 2003A head-and-shoulders test during a bear rally
- 2004Pattern breakouts need a primary-trend filter
- 2004Reading candlestick closes on trendline and neckline tests
- 2004Candle diagnosis needs Western targets and stops
- 2004Head-and-shoulders neckline construction
- 2005A familiar chart condition is a hypothesis, not a completed decision
- 2005A 50-day ceiling and a rising-floor stalemate
- 2006A complete trading plan from philosophy to checklist
- 2006Thin-market head and shoulders with two averages and MACD confirmation
- 2010Head and shoulders as a playback-tested setup
- 2011Turning a head-and-shoulders outline into a breakout hypothesis
- 2011Volume-confirmed head and shoulders on AIG and Citigroup in 2007
- 2013Constructing head-and-shoulders milestone points
- 2013Head-and-shoulders geometry versus the filter stack
- 2013Algorithmic head-and-shoulders construction
- 2018International relative strength as a double-top case study
- 2019Structure invalidation before comfort-stops