2003issue C131-4
A head-and-shoulders test during a bear rally
A late-2002 case kept a primary downtrend of lower highs and lower lows in force while a weekly large-cap index sat under a completed head-and-shoulders neckline near 965. A new-trend label waited on contrary price structure, with volume-price alignment and the Relative Strength Index used as further confirmation readings.
- The case treated a sequence of lower highs and lower lows as the working downtrend until contrary price structure appeared.
- A weekly large-cap index was shown as a completed head-and-shoulders top with a neckline near 965, and a hold above that level was required before an uptrend could be confirmed.
- The measured-move rule produced a minimum downside objective of 377 on the index and 40 on a depositary-receipt proxy then trading near 90.
- Volume-price analysis treated same-direction participation as constructive, while the Relative Strength Index was a second reading and weaker than volume-inclusive flow tools.
The working downtrend
A late-2002 case defined a primary downtrend as a sequence of lower highs and lower lows. That sequence remained the working hypothesis until contrary price structure appeared.
The same case withheld a trend-change label until a higher low, a higher high, a break of resistance, and newly accepted support were in place.
The completed top
A weekly large-cap index chart was presented as a completed head-and-shoulders top whose neckline sat near 965. A hold above that level was required before an uptrend could be confirmed.
A head-and-shoulders pattern is a three-swing reversal template of left shoulder, head, and right shoulder around a neckline. A top argues that an advance has lost control. The neckline is the boundary connecting the reaction points between shoulders and head. A decisive move through it completes the pattern and supplies the measuring baseline.
The left shoulder, head, and right shoulder were narrated as a multi-month shift from buyer control at the late-1990s peak to seller control. The right shoulder stalled near the same area as the left before a failed neckline test.
Weekly S&P 500 still under a completed head-and-shoulders neckline
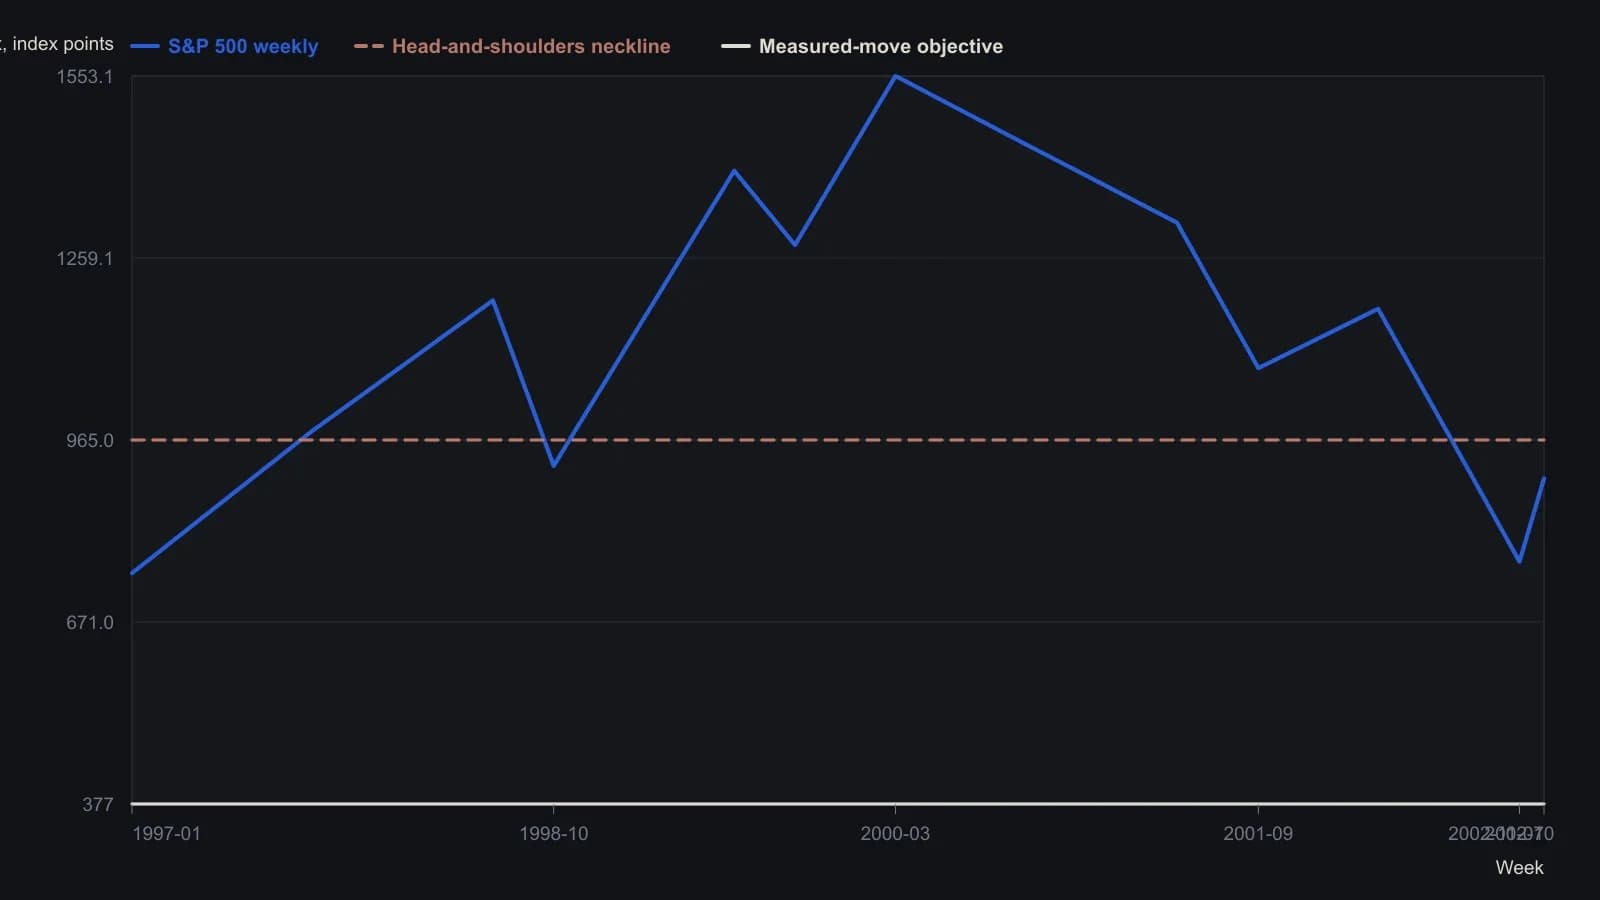
Last bar on the source plot is the week of 7 November 2002 (open 900.96, high 925.66, low 898.68, close 902.65). Pattern height is 1553.1 minus 965, so 588 points; 965 minus 588 is the 377 objective. Months for unlabeled dates were read from the year ticks. Unlabeled prices are only as fine as the weekly raster allows.
A measured-move objective
Applying the measured-move rule, the write-up subtracted the neckline from the head, taking 1553 minus 965. It then subtracted that 588-point height from the neckline to produce a minimum downside objective of 377. A measured-move projects the head-to-neckline height an equal distance beyond the neckline as a minimum structural objective, not a promise of arrival.
A depositary-receipt proxy of the same market was used as a second head-and-shoulders confirmation. The same height rule produced a projected level of 40 against a then-recent price near 90.
Volume and price alignment
Volume-price analysis noted participation expanding with advances on the left side of the pattern and with declines on the right. Same-direction volume and price were treated as constructive. Opposite movement was treated as a warning.
The method reads whether participation expands with advances or with declines to judge which side is funding the move.
The Relative Strength Index as a second reading
Relative Strength Index readings were described as declining with money-flow measures. Volume-inclusive flow tools were treated as stronger confirmation than the Relative Strength Index, stochastics, or a commodity-channel reading alone.
The Relative Strength Index is a bounded momentum oscillator. In this case it was used as a second reading on whether a bounce has enough internal strength to challenge a completed top.
What still had to happen
Until a hold above the neckline near 965 appeared, the completed top and the failed neckline test stayed inside the primary-downtrend hypothesis. A new-trend label still required a higher low, a higher high, a break of resistance, and newly accepted support.
Those price tests were the archive rule for replacing a sequence of lower highs and lower lows. Volume-price alignment and the Relative Strength Index were further readings on whether a bounce had earned that label.
All readings on this track · 37 readings
- 1982Head and shoulders as a three-path completion test
- 1984Stock low clusters as a cycle baseline
- 1985Four-phase construction of the head-and-shoulders reversal
- 1989Volume-confirmed reversal patterns, stops, and measured objectives
- 1991The journal as one checklist for taken and skipped trades
- 1991Head and shoulders as a direction hypothesis
- 1991Candlestick body and shadow construction with three-Buddha peaks
- 1992A three-count drill that binds candlesticks, head and shoulders, and entry rules
- 1997Constructing bump and run reversal channels
- 1998Testing reversal formations in bond futures
- 1999Construction first: extra shoulders, the neckline, and the diamond test
- 1999Dead-cat bounce, rollover, and failed reversals
- 1999Evaluating time gaps in bond reversal patterns
- 2000Constructing head and shoulders and double reversal patterns
- 2001Constructing broadening and complex bottoms
- 2001Constructing a slanted head-and-shoulders when the chart is tilted
- 2002Head and shoulders with dominant-cycle timing
- 2002Trendline breaks, right shoulders, and trailing stops
- 2003Confirmation tests for bearish top patterns
- 2003Commodity top hypotheses on a dollar rebound
- 2003A head-and-shoulders test during a bear rally
- 2004Pattern breakouts need a primary-trend filter
- 2004Reading candlestick closes on trendline and neckline tests
- 2004Candle diagnosis needs Western targets and stops
- 2004Head-and-shoulders neckline construction
- 2005A familiar chart condition is a hypothesis, not a completed decision
- 2005A 50-day ceiling and a rising-floor stalemate
- 2006A complete trading plan from philosophy to checklist
- 2006Thin-market head and shoulders with two averages and MACD confirmation
- 2010Head and shoulders as a playback-tested setup
- 2011Turning a head-and-shoulders outline into a breakout hypothesis
- 2011Volume-confirmed head and shoulders on AIG and Citigroup in 2007
- 2013Constructing head-and-shoulders milestone points
- 2013Head-and-shoulders geometry versus the filter stack
- 2013Algorithmic head-and-shoulders construction
- 2018International relative strength as a double-top case study
- 2019Structure invalidation before comfort-stops