2002issue C041-3
Head and shoulders with dominant-cycle timing
The archive keeps a head-and-shoulders-top only inside a pre-specified dominant-cycle late-phase-window. Editorial: treat the neckline as a dated confirmation line that can confirm or kill that timing hypothesis, not as a forecast on its own.
- A head-and-shoulders-top is three post-advance peaks with the middle peak highest, and the neckline through the two intervening troughs is the dated breakout reference.
- A programmed scan found the isolated geometry often, but at each scored horizon cases that did not follow through outnumbered cases that did.
- A separate cycle chronology treated the third phase of a three-phase primary wave as the late-phase-window and used a neckline break to confirm a crest or trough.
- Editorial: require that late-phase-window first, then let the neckline confirm or kill the independent timing hypothesis.
What the archive combined
A head-and-shoulders-top is specified as three post-advance peaks whose middle peak is highest, with a neckline drawn through the two intervening troughs and used as the breakout reference. The isolated pattern was not treated as a sufficient trend-change forecast. The proposed combination is to accept the geometry only when it appears in the late-phase-window of a pre-specified dominant-cycle.
How the geometry was identified
Identification checks also include shoulders near the same price, similar shoulder-to-head distances, volume that is typically heaviest on the left shoulder and lightest on the right, and a downward neckline pierce that may include a brief pullback.
Automated detection discarded swings smaller than a 5 percent zigzag-filter, labeled the latest three qualifying peaks as right shoulder, higher head, and left shoulder, and required a negative slope from the right shoulder plus a neckline cross within the last two sessions.
What an isolated scan recorded
A programmed scan of more than 8000 NYSE and Nasdaq listings over 1997-2001 recorded 83282 candidate formations, averaging about 10 per name. Follow-through was scored 5, 20, and 60 days after the neckline event. At each of those horizons, cases that did not move in the implied direction outnumbered cases that did.
Incidence was uneven: 755 names showed none, 8.8 percent of the sample never printed the pattern, counts clustered between 1 and 17, and 1.5 percent of names printed 25 or more.
Where the cycle clock comes in
A separate cycle chronology treated primary swings as a three-phase wave whose third phase is the turning window. Over 1982-1997 that chronology counted 44 primary cycles in a stock-index futures series and noted the head-and-shoulders geometry seven times in that late-phase-window, with the neckline break used to confirm the crest or trough.
The dominant-cycle is a pre-specified primary swing with a stated phase structure, used as an independent clock for when a trend change is due. The late-phase-window is the third segment of that three-phase primary wave, treated as the only interval in which the reversal geometry is considered timely.
How many listed stocks printed each head-and-shoulders count
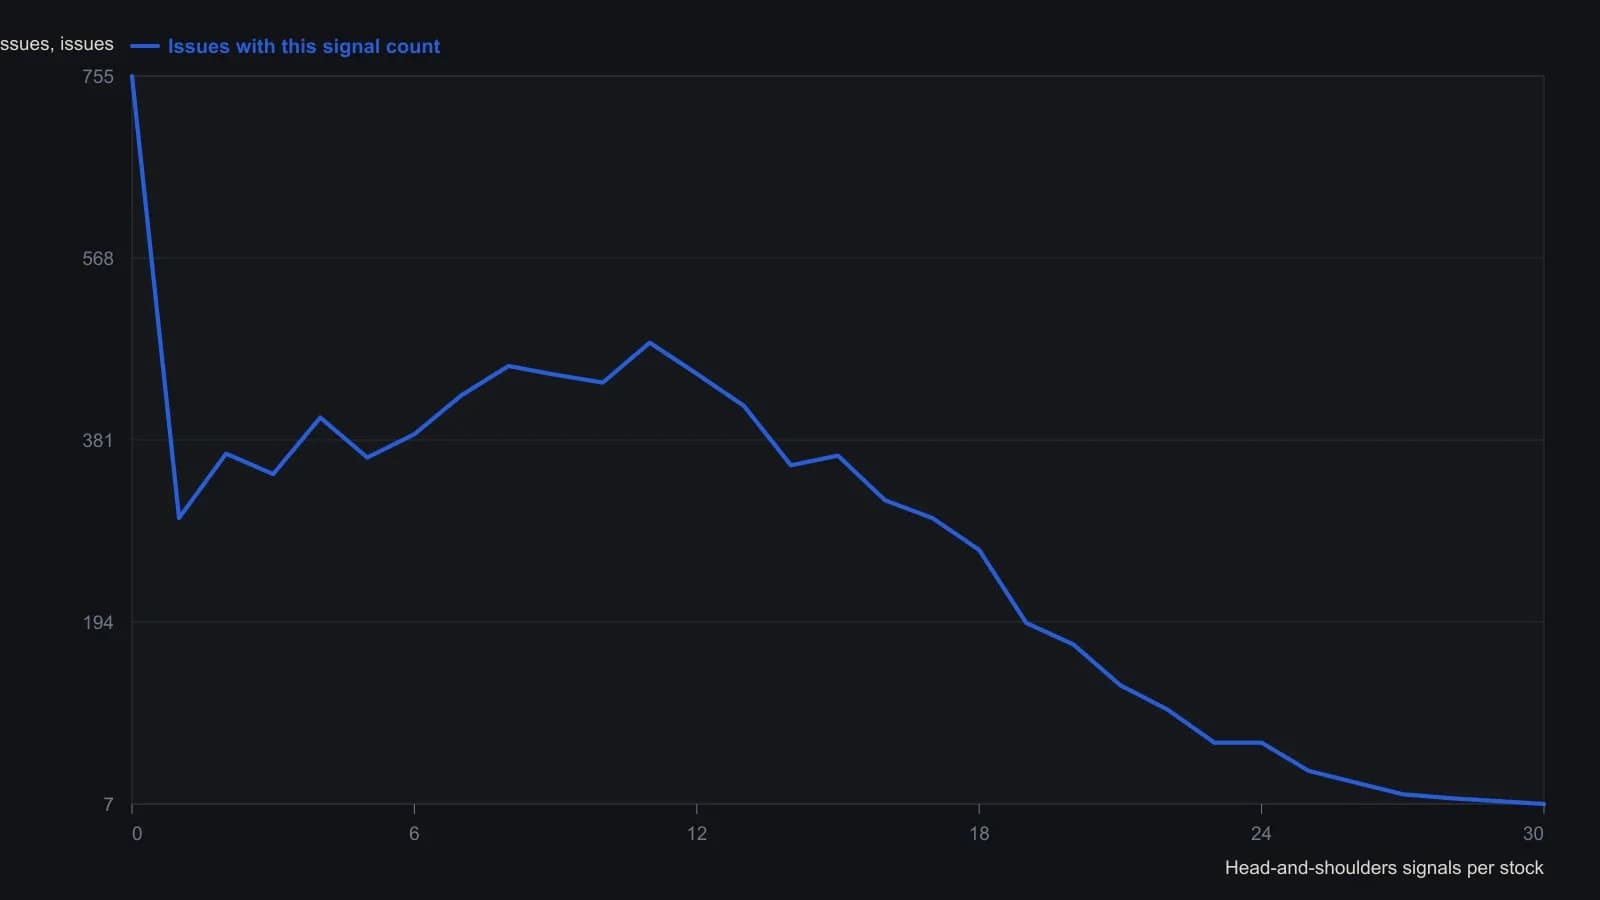
Patterns were identified with TechniFilter Plus logic on a 5 percent zigzag across NYSE and Nasdaq names from 1997 through 2001. The published table stops at thirty signals.
All readings on this track · 37 readings
- 1982Head and shoulders as a three-path completion test
- 1984Stock low clusters as a cycle baseline
- 1985Four-phase construction of the head-and-shoulders reversal
- 1989Volume-confirmed reversal patterns, stops, and measured objectives
- 1991The journal as one checklist for taken and skipped trades
- 1991Head and shoulders as a direction hypothesis
- 1991Candlestick body and shadow construction with three-Buddha peaks
- 1992A three-count drill that binds candlesticks, head and shoulders, and entry rules
- 1997Constructing bump and run reversal channels
- 1998Testing reversal formations in bond futures
- 1999Construction first: extra shoulders, the neckline, and the diamond test
- 1999Dead-cat bounce, rollover, and failed reversals
- 1999Evaluating time gaps in bond reversal patterns
- 2000Constructing head and shoulders and double reversal patterns
- 2001Constructing broadening and complex bottoms
- 2001Constructing a slanted head-and-shoulders when the chart is tilted
- 2002Head and shoulders with dominant-cycle timing
- 2002Trendline breaks, right shoulders, and trailing stops
- 2003Confirmation tests for bearish top patterns
- 2003Commodity top hypotheses on a dollar rebound
- 2003A head-and-shoulders test during a bear rally
- 2004Pattern breakouts need a primary-trend filter
- 2004Reading candlestick closes on trendline and neckline tests
- 2004Candle diagnosis needs Western targets and stops
- 2004Head-and-shoulders neckline construction
- 2005A familiar chart condition is a hypothesis, not a completed decision
- 2005A 50-day ceiling and a rising-floor stalemate
- 2006A complete trading plan from philosophy to checklist
- 2006Thin-market head and shoulders with two averages and MACD confirmation
- 2010Head and shoulders as a playback-tested setup
- 2011Turning a head-and-shoulders outline into a breakout hypothesis
- 2011Volume-confirmed head and shoulders on AIG and Citigroup in 2007
- 2013Constructing head-and-shoulders milestone points
- 2013Head-and-shoulders geometry versus the filter stack
- 2013Algorithmic head-and-shoulders construction
- 2018International relative strength as a double-top case study
- 2019Structure invalidation before comfort-stops