2013issue C0526-35
Algorithmic head-and-shoulders construction
A completed closing-price head-and-shoulders is outlined only after closing price crosses the neckline, using named milestone-points. Nine geometric tests of height, slope, timing, and intervening swings then decide whether that outline is accepted. The identification-algorithm is a recognition procedure, not a trading system.
- Outline a completed closing-price head-and-shoulders only after the close crosses the neckline, using named milestone-points.
- Apply nine geometric tests so shoulder height, neckline slope, flank timing, and intervening swings can each reject the outline.
- Keep dist1 and dist2, plus the outer-trough flanks, inside fixed multiples so the peaks and troughs stay temporally balanced.
- Treat the identification-algorithm as pattern recognition. An interpolating sketch and 0.80-to-1.20 scale factors can search longer or less symmetric cases.
Milestone-points after the neckline
A completed closing-price head-and-shoulders is outlined only after closing price has crossed the neckline, using a sequence of named milestone-points. Those points are the highs and lows that mark the shoulders, the head, the two interior troughs on the neckline, and the outer troughs.
The neckline is the line through the two interior troughs. Pattern completion is defined when closing price crosses that line. The head is the highest peak between the two shoulder peaks in the closing-price structure.
Shoulder placement
The shoulders are the left and right peaks that must stay high enough above their adjacent troughs and far enough below the head. The left-shoulder peak must sit above a 20 percent lift from its trough toward the head and at least 15 percent of that same head-to-trough span below the head.
The right-shoulder peak must sit above a 25 percent lift from its trough and at least 25 percent of that span below the head.
Interior troughs and the neckline
The right interior trough must stay within 15 percent below and 40 percent above the left interior trough, measured on the left-head vertical span. Extremely downward-sloping necklines are excluded by that band.
If the right interior trough is more than 20 percent of the left-head span above the left trough, one extra swing check applies. The highest close in the rightmost third of the head-to-right-trough interval must stay below 70 percent of the remaining rise from that trough to the head.
Relative shoulder height
Shoulder heights must differ by less than the shorter shoulder. Each shoulder must exceed 25 percent of its head-to-trough span unless the shorter of the two peak-to-adjacent-trough times is more than 25 percent of the trough-to-trough bar count.
Flank timing
Peak-to-peak timing is acceptable only when the longer of the two head-flank distances is under 2.5 times the shorter. Those flanks are dist1, the bar count from the left-shoulder peak to the head, and dist2, the bar count from the head to the right-shoulder peak. The longer of the two outer-trough flanks must stay under three times the shorter.
Intervening swings
Between the left trough and the head, the gap between the highest close in the left half and the lowest close in the right half must stay under half the head-to-left-trough height. That bound keeps the head from dissolving into a large intervening swing.
On the right shoulder, the first-third high must not sit above 80 percent of that shoulder's height unless the last-third low stays at least 40 percent of that height above the right trough.
Bounds before and after the pattern
The post-pattern high after the right outer trough must stay below one-third of the rise from that trough to the right-shoulder peak. The pre-pattern high before the left-shoulder peak must stay at least 15 percent of the left-head span below the head.
An identification-algorithm, not a trading system
The nine geometric tests plus the prior milestone-points scan form an identification-algorithm: a loop-light checklist of vertical, temporal, and swing tests that flags a head-and-shoulders outline from those points. The procedure is a pattern-recognition method, not a trading system.
A simple interpolating function can sketch the outline. Integer duration and 0.80-to-1.20 scale factors can search longer or less symmetric cases.
Eight Boyd Gaming H&S durations from the recursive scan
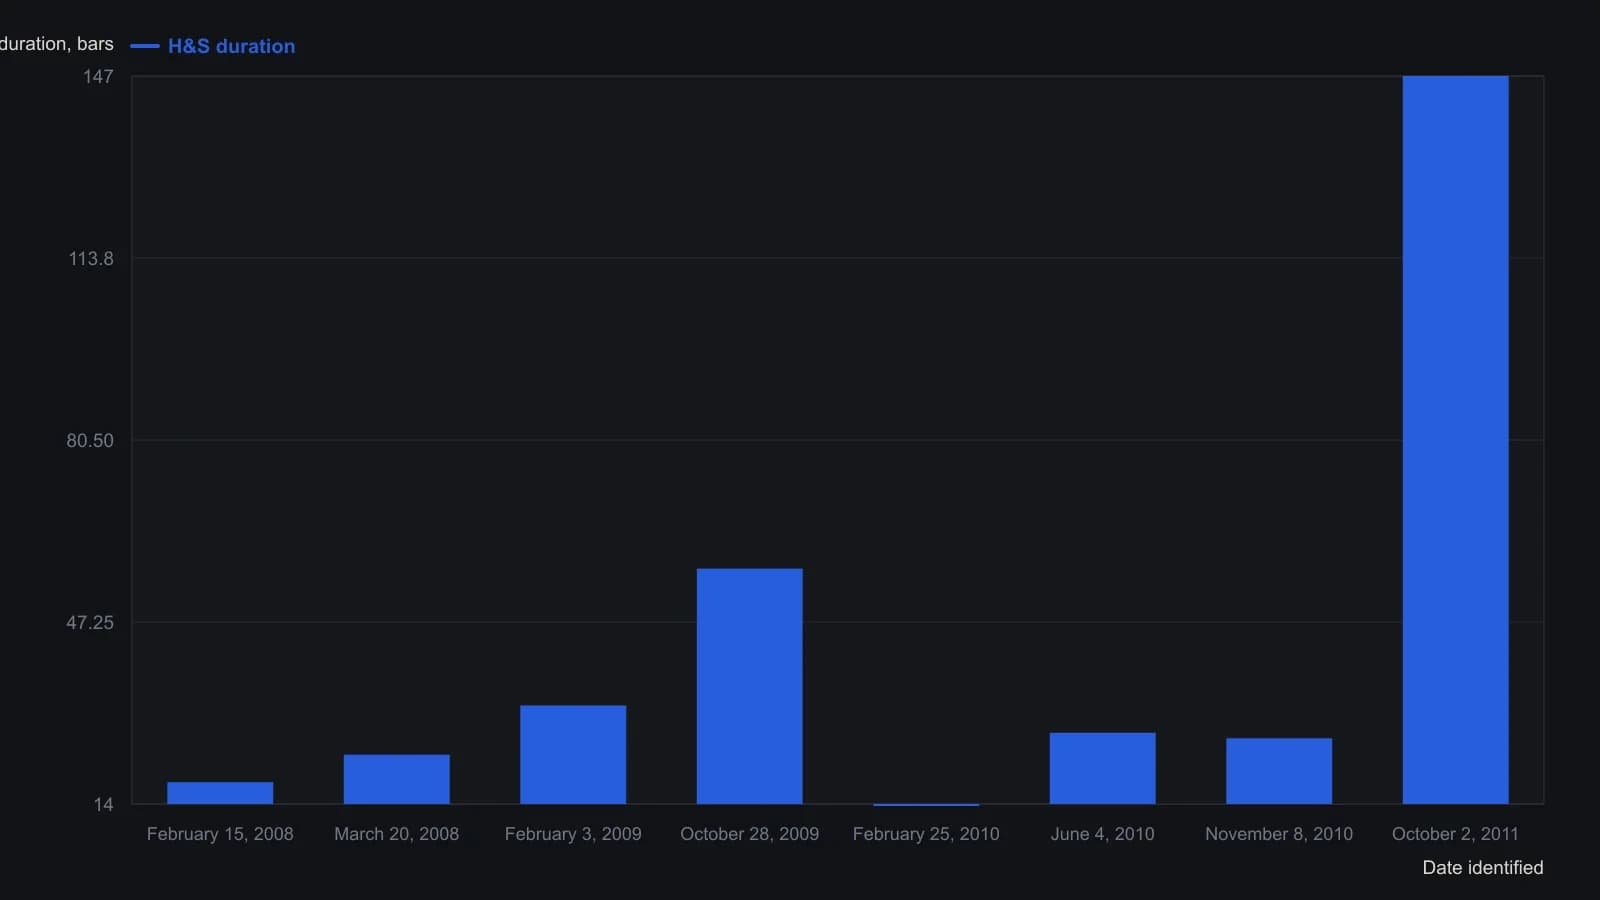
Siligardos warns that seven-of-eight declines on this sample overstate the pattern’s standalone power; extra filters and measured targets are still required before taking the short side.
All readings on this track · 37 readings
- 1982Head and shoulders as a three-path completion test
- 1984Stock low clusters as a cycle baseline
- 1985Four-phase construction of the head-and-shoulders reversal
- 1989Volume-confirmed reversal patterns, stops, and measured objectives
- 1991The journal as one checklist for taken and skipped trades
- 1991Head and shoulders as a direction hypothesis
- 1991Candlestick body and shadow construction with three-Buddha peaks
- 1992A three-count drill that binds candlesticks, head and shoulders, and entry rules
- 1997Constructing bump and run reversal channels
- 1998Testing reversal formations in bond futures
- 1999Construction first: extra shoulders, the neckline, and the diamond test
- 1999Dead-cat bounce, rollover, and failed reversals
- 1999Evaluating time gaps in bond reversal patterns
- 2000Constructing head and shoulders and double reversal patterns
- 2001Constructing broadening and complex bottoms
- 2001Constructing a slanted head-and-shoulders when the chart is tilted
- 2002Head and shoulders with dominant-cycle timing
- 2002Trendline breaks, right shoulders, and trailing stops
- 2003Confirmation tests for bearish top patterns
- 2003Commodity top hypotheses on a dollar rebound
- 2003A head-and-shoulders test during a bear rally
- 2004Pattern breakouts need a primary-trend filter
- 2004Reading candlestick closes on trendline and neckline tests
- 2004Candle diagnosis needs Western targets and stops
- 2004Head-and-shoulders neckline construction
- 2005A familiar chart condition is a hypothesis, not a completed decision
- 2005A 50-day ceiling and a rising-floor stalemate
- 2006A complete trading plan from philosophy to checklist
- 2006Thin-market head and shoulders with two averages and MACD confirmation
- 2010Head and shoulders as a playback-tested setup
- 2011Turning a head-and-shoulders outline into a breakout hypothesis
- 2011Volume-confirmed head and shoulders on AIG and Citigroup in 2007
- 2013Constructing head-and-shoulders milestone points
- 2013Head-and-shoulders geometry versus the filter stack
- 2013Algorithmic head-and-shoulders construction
- 2018International relative strength as a double-top case study
- 2019Structure invalidation before comfort-stops