2011issue C129-10
Volume-confirmed head and shoulders on AIG and Citigroup in 2007
Replacement daily charts for AIG and Citigroup restored the correct 20-session and 50-session closing averages around two late-2007 pattern windows. Editorial reading treats last-week volume that exceeds both the pattern-window average and the prior twelve-month daily average as the check that turns a head-and-shoulders sketch into a breakout hypothesis.
- A head-and-shoulders structure becomes a usable signal only at a neckline break after the right shoulder, not from visual resemblance alone.
- The published daily pair used a 20-session closing average and a 50-session closing average, but the longer overlay had been mislabeled as a 20-session average; replacement charts restored the true moving-average horizons.
- The AIG window ran from 9 October 2007 through 21 November 2007 and the Citigroup window from 11 October 2007 through 9 November 2007; both were contemporaneous, and both showed last-week volume above an already elevated pattern-window average.
- Last-week volume that exceeds both the pattern-window average and the prior-year daily average is the checkable condition for treating the late structure as a breakout hypothesis rather than a silhouette.
A confirmation lab
Editorial reading: TradersWeek treats the 2007 AIG and Citigroup replay as a confirmation lab. A head-and-shoulders breakdown stays a sketch until last-week volume beats both the pattern-window average and the prior twelve-month daily average, and until every moving-average overlay used to frame that neckline is the horizon actually plotted.
A head-and-shoulders pattern is a three-swing reversal structure. The usable signal is a neckline break after the right shoulder, not visual resemblance alone. A pattern-window is the dated interval over which that structure is measured, not a loosely remembered cluster of bars.
The moving-average horizon has to match the plot
A published pair of daily charts used one 20-session closing moving average and one 50-session closing moving average. The longer overlay had been mislabeled as a 20-session average.
A moving-average-horizon is the lookback of a closing average used to contextualize the structure. A 20-session overlay and a 50-session overlay are not interchangeable labels. Replacement daily charts for AIG and Citigroup were issued so the late-2007 pattern windows could be read against the correct moving-average horizons.
Two contemporaneous windows
The two pattern windows were contemporaneous in late 2007 but not identical. AIG's window ran from 9 October to 21 November, while Citigroup's ran from 11 October to 9 November.
Volume against two baselines
Volume-price analysis compares window or last-week volume with a prior-period daily baseline so participation can support or reject the price structure.
On the AIG daily chart, average daily volume from 9 October 2007 through 21 November 2007 was 1,062,828, compared with 509,327 over the prior 12 months. On the Citigroup daily chart, average daily volume from 11 October 2007 through 9 November 2007 was 64,854,100, compared with 24,940,050 over the prior 12 months.
For both names, average daily volume in the last week of the identified pattern was higher than the already elevated pattern-window average.
AIG daily close and 50-day average, 2007
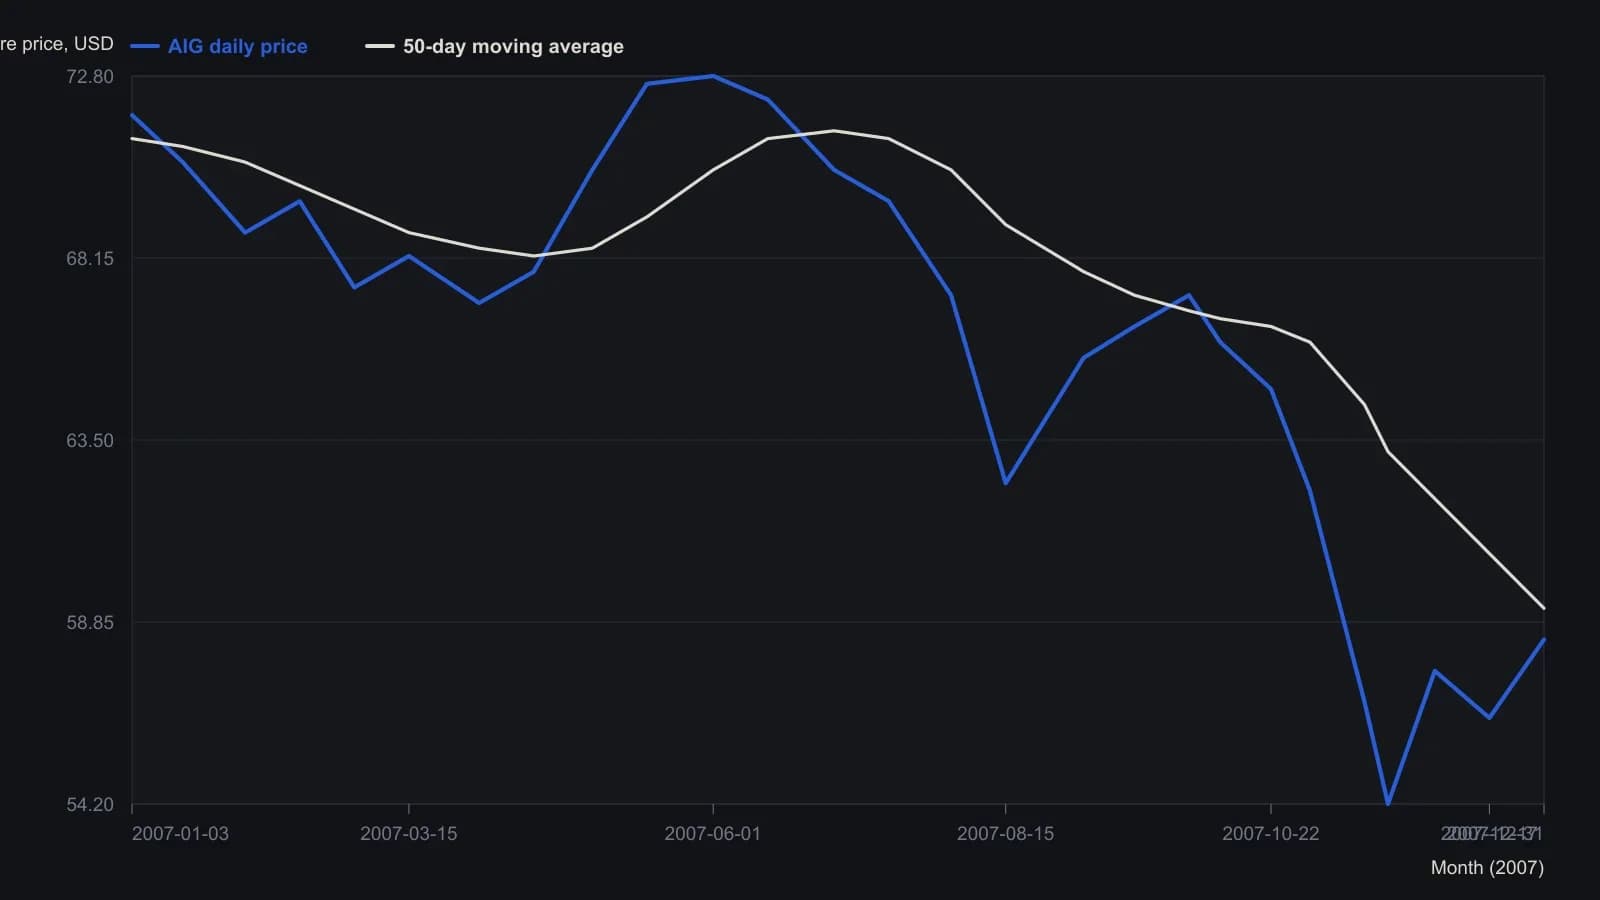
Daily candlesticks and the 50-session closing average were sampled from the raster at roughly biweekly spacing; y-values are approximate. Volume averages in the caption (1,062,828 in the Oct 9–Nov 21 window versus 509,327 over the prior twelve months) are the exact figures stated in the figure note.
Breakout as a live hypothesis
Editorial reading: a breakout is price leaving the pattern boundary with a defined invalidation. It is treated as a live hypothesis only when volume expands into the departure. The archive supplies the corrected overlays and the two-baseline volume comparison. Editorial reading stops at those confirmation tests and does not assign a trade outcome.
All readings on this track · 37 readings
- 1982Head and shoulders as a three-path completion test
- 1984Stock low clusters as a cycle baseline
- 1985Four-phase construction of the head-and-shoulders reversal
- 1989Volume-confirmed reversal patterns, stops, and measured objectives
- 1991The journal as one checklist for taken and skipped trades
- 1991Head and shoulders as a direction hypothesis
- 1991Candlestick body and shadow construction with three-Buddha peaks
- 1992A three-count drill that binds candlesticks, head and shoulders, and entry rules
- 1997Constructing bump and run reversal channels
- 1998Testing reversal formations in bond futures
- 1999Construction first: extra shoulders, the neckline, and the diamond test
- 1999Dead-cat bounce, rollover, and failed reversals
- 1999Evaluating time gaps in bond reversal patterns
- 2000Constructing head and shoulders and double reversal patterns
- 2001Constructing broadening and complex bottoms
- 2001Constructing a slanted head-and-shoulders when the chart is tilted
- 2002Head and shoulders with dominant-cycle timing
- 2002Trendline breaks, right shoulders, and trailing stops
- 2003Confirmation tests for bearish top patterns
- 2003Commodity top hypotheses on a dollar rebound
- 2003A head-and-shoulders test during a bear rally
- 2004Pattern breakouts need a primary-trend filter
- 2004Reading candlestick closes on trendline and neckline tests
- 2004Candle diagnosis needs Western targets and stops
- 2004Head-and-shoulders neckline construction
- 2005A familiar chart condition is a hypothesis, not a completed decision
- 2005A 50-day ceiling and a rising-floor stalemate
- 2006A complete trading plan from philosophy to checklist
- 2006Thin-market head and shoulders with two averages and MACD confirmation
- 2010Head and shoulders as a playback-tested setup
- 2011Turning a head-and-shoulders outline into a breakout hypothesis
- 2011Volume-confirmed head and shoulders on AIG and Citigroup in 2007
- 2013Constructing head-and-shoulders milestone points
- 2013Head-and-shoulders geometry versus the filter stack
- 2013Algorithmic head-and-shoulders construction
- 2018International relative strength as a double-top case study
- 2019Structure invalidation before comfort-stops