2018issue C0318-21
International relative strength as a double-top case study
The historical workflow marked a completed double top on the EFA-versus-U.S. large-cap relative-strength line, then a long decline and a later leadership window. As an editorial reading, that two-peak structure is the first falsifiable reversal hypothesis. Any later recovery is either a neckline-style breakout or a failed inverse head-and-shoulders if the line is rejected, and only then does the same test move from one week to a multi-week and monthly confirmation cluster.
- The historical workflow identified a double top on the EFA-versus-U.S. large-cap relative-strength line at the May 2008 and September 2009 peaks, then described a long decline through March 2017.
- As an editorial reading, that completed double-top-bottom is the first falsifiable reversal hypothesis on the relative-strength-line, not a completed leadership call.
- A later recovery is read here as either a neckline-style breakout or a failed inverse head-and-shoulders if the line is rejected, and only then is the same test promoted from one week to a few weeks and a month or more.
- The archive confirmation-cluster used a 20-day moving average, RSI set to 9, and MACD settings of 12, 26, and 9. The 11 largest ex-U.S. funds were not treated as one pattern universe because of composition-mismatch.
The line under test
The historical workflow started with a relative-strength-line, the single comparative path of EFA versus a U.S. large-cap index, rather than with a basket of overseas tickers. That line was identified as forming a double top in May 2008 and September 2009.
After the second peak, the same EFA-versus-index relative-strength series was described as remaining in a long decline through March 2017. Those two peaks and the long path that followed are the archive facts this article keeps in view.
The completed double top
A double-top-bottom is a two-peak or two-trough reversal in price or relative strength that becomes a testable hypothesis once the intervening swing is broken. The archive identification of the May 2008 and September 2009 peaks supplies that two-peak structure on the relative-strength-line.
As an editorial reading, those peaks are a condition to keep or kill, not a completed leadership call. The hypothesis remains open until the intervening swing is broken, and it remains open again if a later recovery fails to hold.
S&P 500 versus international equity ETFs, October 2012–January 2018
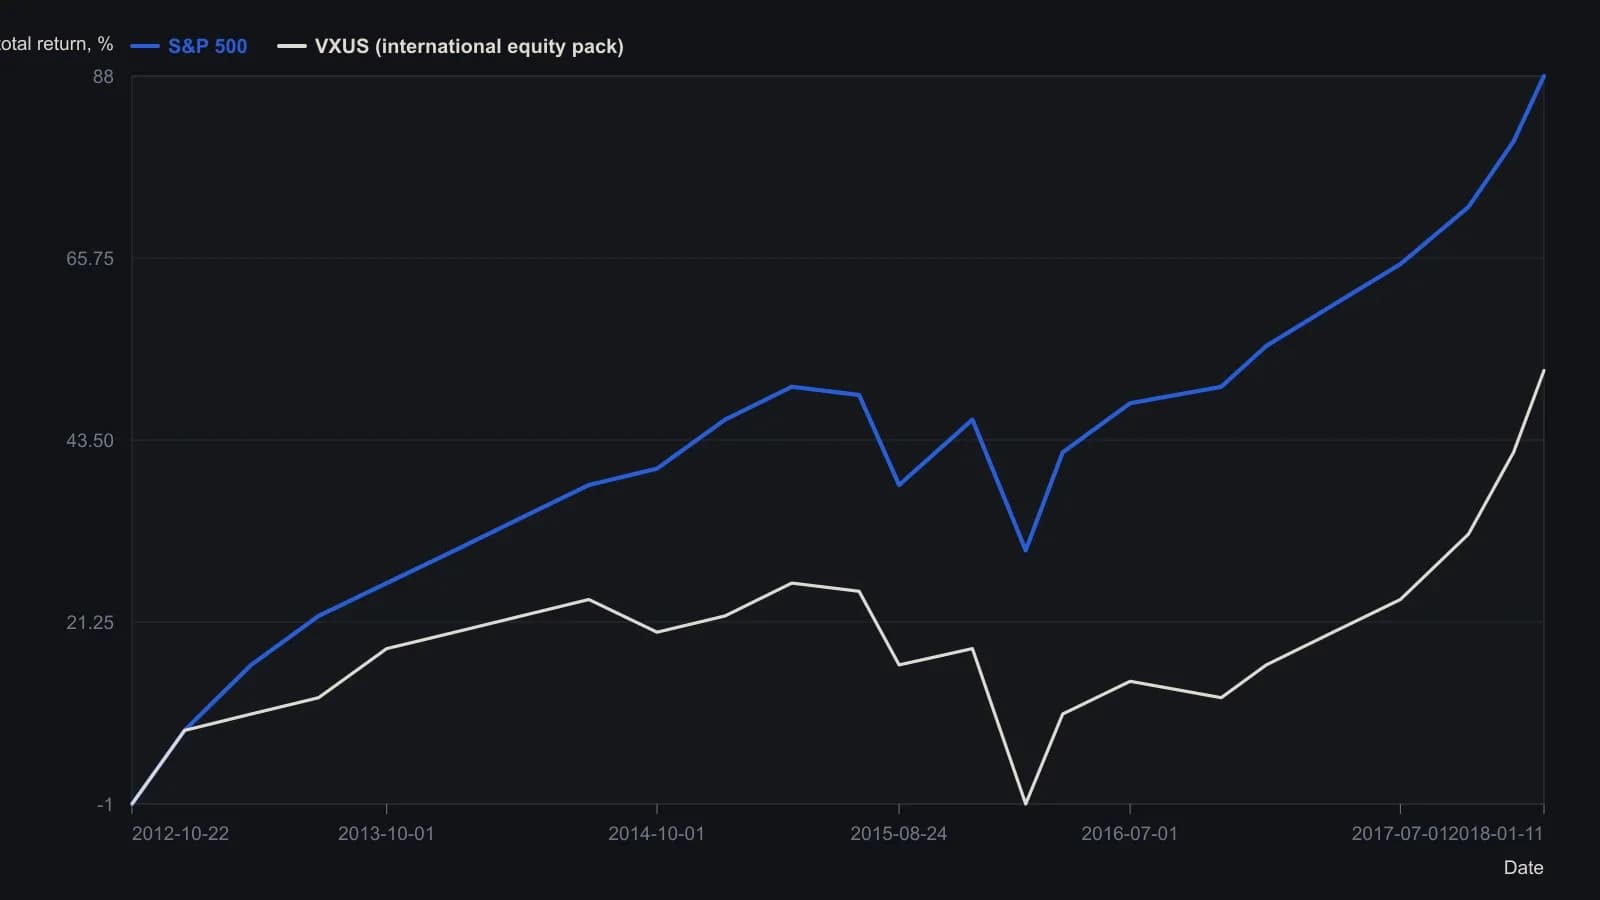
The four international lines (VEU, VXUS, IXUS, ACWX/CWI) overlap on the printed pane, so only VXUS is carried as the named international series. Intermediate points are approximate to the 5% grid; Masonson's stated +56.60% / +96% totals are for 18 January 2018, a week after the pane's printed end date.
Recovery as breakout or failed reversal
A later window beginning March 8, 2017 was used to show EFA leading the S&P 500 through much of that year and then lagging after mid-November. That is the archive description of the path after the long decline.
As an editorial reading, that later path is the second test on the same line. A breakout is acceptance beyond a stated swing level that confirms the chart hypothesis instead of treating the first tick as the signal. If the line is rejected, the same recovery can be read as a failed inverse head-and-shoulders, a three-swing reversal whose middle extreme is the head and whose neckline through the two intervening swings is the line that validates or kills the pattern.
Expanding the clock
A change in relative strength was to be watched first over one week, then over a few weeks, then over a month or more before treating leadership as having turned. Trend-change confirmation on that work used a 20-day moving average, RSI set to 9, and MACD settings of 12, 26, and 9.
That grouping is the confirmation-cluster: a short moving average plus a fast RSI and a standard MACD used together to ratify a change in leadership after the time horizon has already expanded. As an editorial reading, the cluster is applied only after the pattern hypothesis is already on the table and after the week-to-month clock has been respected. It does not replace the double-top-bottom, the head-and-shoulders neckline, or the breakout test.
What the substitute list is not
Five broad international equity ETFs, VEU, VXUS, IXUS, ACWX, and CWI, were compared with one another and with the S&P 500 on a shared window starting October 22, 2012. Broad international equity ETFs were described as highly correlated, with EFA versus VEA cited at 97.9 percent, implying similar price structure across those substitutes.
The 11 largest ex-U.S. ETFs by assets mixed total-stock, small-cap, real-estate, and fixed-income mandates, so the ticker list was not treated as a single chart-pattern universe. That restraint is how the historical workflow avoided composition-mismatch. Several large overseas tickers are not one pattern universe when they mix equity, small-cap, real-estate, and bond mandates.
As an editorial caution, currency-risk is extra path variance in unhedged overseas holdings that can distort a price-structure signal even when the local-market pattern is unchanged. High correlation among broad equity substitutes does not remove that extra variance from an unhedged relative-strength-line.
All readings on this track · 37 readings
- 1982Head and shoulders as a three-path completion test
- 1984Stock low clusters as a cycle baseline
- 1985Four-phase construction of the head-and-shoulders reversal
- 1989Volume-confirmed reversal patterns, stops, and measured objectives
- 1991The journal as one checklist for taken and skipped trades
- 1991Head and shoulders as a direction hypothesis
- 1991Candlestick body and shadow construction with three-Buddha peaks
- 1992A three-count drill that binds candlesticks, head and shoulders, and entry rules
- 1997Constructing bump and run reversal channels
- 1998Testing reversal formations in bond futures
- 1999Construction first: extra shoulders, the neckline, and the diamond test
- 1999Dead-cat bounce, rollover, and failed reversals
- 1999Evaluating time gaps in bond reversal patterns
- 2000Constructing head and shoulders and double reversal patterns
- 2001Constructing broadening and complex bottoms
- 2001Constructing a slanted head-and-shoulders when the chart is tilted
- 2002Head and shoulders with dominant-cycle timing
- 2002Trendline breaks, right shoulders, and trailing stops
- 2003Confirmation tests for bearish top patterns
- 2003Commodity top hypotheses on a dollar rebound
- 2003A head-and-shoulders test during a bear rally
- 2004Pattern breakouts need a primary-trend filter
- 2004Reading candlestick closes on trendline and neckline tests
- 2004Candle diagnosis needs Western targets and stops
- 2004Head-and-shoulders neckline construction
- 2005A familiar chart condition is a hypothesis, not a completed decision
- 2005A 50-day ceiling and a rising-floor stalemate
- 2006A complete trading plan from philosophy to checklist
- 2006Thin-market head and shoulders with two averages and MACD confirmation
- 2010Head and shoulders as a playback-tested setup
- 2011Turning a head-and-shoulders outline into a breakout hypothesis
- 2011Volume-confirmed head and shoulders on AIG and Citigroup in 2007
- 2013Constructing head-and-shoulders milestone points
- 2013Head-and-shoulders geometry versus the filter stack
- 2013Algorithmic head-and-shoulders construction
- 2018International relative strength as a double-top case study
- 2019Structure invalidation before comfort-stops