1998issue C111-5
Testing reversal formations in bond futures
Head-and-shoulders and double-top or double-bottom sketches become testable only after swings, symmetry, and breakout completion are written as explicit rules. This archive article follows that rules-first experiment on one continuous Treasury bond futures series.
- Define reactionary highs and lows first so every later pattern sits on the same swing series.
- A head-and-shoulders top needs four consecutive reactionary highs after an uptrend and is completed only by a timely decline through the neckline that does not rise above the head.
- Vertical and horizontal symmetry filters drop lopsided sketches before a price objective or trade rule is allowed.
- The coded short enters at the settlement on the first close below the neckline, takes profit on the first close below the measured price objective, and books a loss on the first close above the right shoulder.
Write the sketch as checks a series can fail
Editorial: chart-pattern evaluation starts when a sketch is rewritten as a sequence of checks that a single market series can pass or fail. This article follows that rules-first path for head-and-shoulders and for double-top and double-bottom formations.
The historical workflow first defined swings, then required an uptrend context, then applied symmetry filters, then treated a move through the neckline as a completion hypothesis, and only then attached an entry, a price objective, and a failure exit.
Start with reactionary highs and lows
A reactionary high is a local maximum more than 1 point, or 32 ticks, above the previous reactionary low. A reactionary low is a local minimum more than 32 ticks below the previous reactionary high.
Those two definitions create the swing series on which later pattern rules operate. Editorial: without a shared swing rule, two readers can disagree about whether the same chart even contains a formation.
Code the head-and-shoulders top after an uptrend
A head-and-shoulders top requires four consecutive reactionary highs. The last three of those highs serve as the left shoulder, the head, and the right shoulder, and the head must stand above both shoulders.
To place the formation after an uptrend, the left shoulder must stand above the prior reactionary high and the left armpit must stand above the previous reactionary low.
The neckline is the line connecting the left and right armpits. A close through that line is the event that can complete the pattern.
Filter lopsided formations with symmetry
Vertical symmetry requires each shoulder to sit above, and each armpit below, the midpoint of the opposite shoulder and armpit. The rule rejects formations that are lopsided in height.
Horizontal symmetry requires the number of days from the left shoulder to the head to be no more than 2.5 times and no less than 0.4 times the number of days from the head to the right shoulder.
Complete the top and state a price objective
After the right shoulder forms, a decline through the neckline completes the top only if that drop lasts no longer than the span between the shoulders and price does not rise above the head.
The stated price objective equals the height of the pattern projected from the breakout level. The bottom definition is the inverse of the top.
Attach one entry and two exits
The coded head-and-shoulders top enters short at the settlement on the first close below the neckline. It exits for a profit on the first close below the objective and books a loss on the first close above the right shoulder. The bottom rule is the inverse.
Editorial: those three prices turn the completed formation into a hypothesis that the same series can accept or reject. They are not a recommendation to trade the pattern.
T-bond head-and-shoulders bottom, 1992
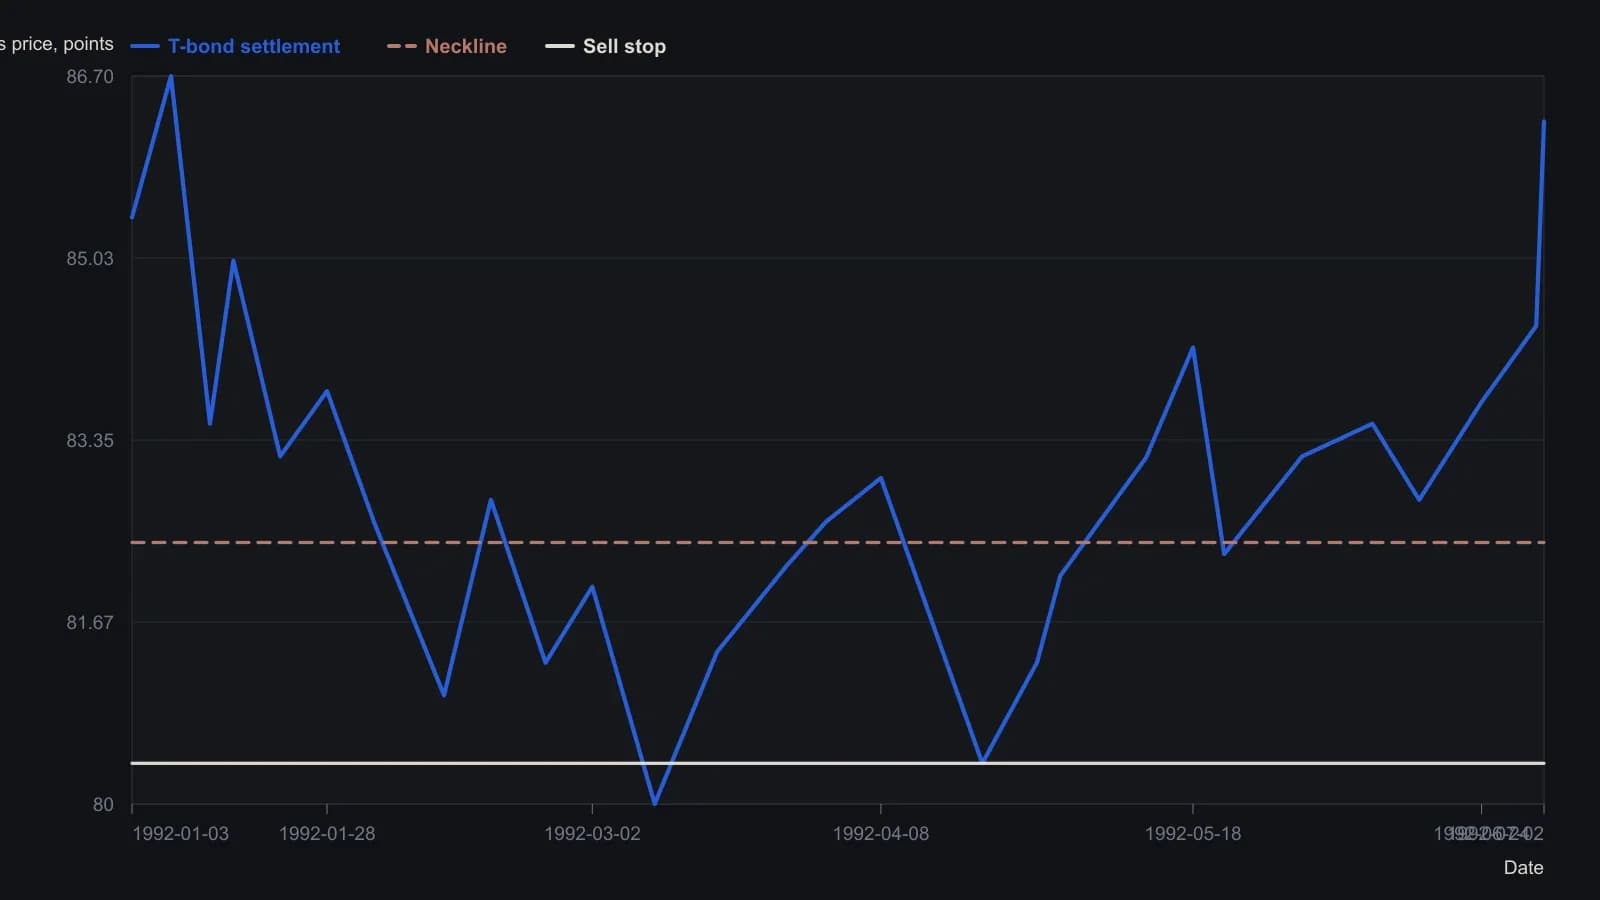
Wiggles along the curve are approximate readings from the printed raster and are shown in decimal points. 32nd-of-a-point quotes in the article convert as 82-13/32 = 82.40625, 80-12/32 = 80.375, 83-06/32 = 83.1875 and 86-09/32 = 86.28125. The study used rollover-adjusted daily closes, one contract, and no slippage or commission.
Keep double tops and bottoms on the same experiment path
A double top or double bottom is a two-peak or two-trough reversal structure completed on breakout. The inverse definition is used for bottoms.
Editorial: keep the same experiment logic. Name the swings, require completion on breakout, and accept or reject the hypothesis on the same series. Do not treat a freehand double sketch as a result.
Test both reversal families on one continuous series
The test used a continuous Treasury bond futures series adjusted so that no price gap occurred on rollover. It traded one contract and charged no slippage or commission.
Across the 21-year Treasury bond sample the two reversal families produced 28 coded trades, of which 17 were winners, and the average winner was 1.41 times the size of the average loser.
Editorial: those counts describe the historical workflow on one frictionless series. They are not a forecast and they are not investment advice.
All readings on this track · 37 readings
- 1982Head and shoulders as a three-path completion test
- 1984Stock low clusters as a cycle baseline
- 1985Four-phase construction of the head-and-shoulders reversal
- 1989Volume-confirmed reversal patterns, stops, and measured objectives
- 1991The journal as one checklist for taken and skipped trades
- 1991Head and shoulders as a direction hypothesis
- 1991Candlestick body and shadow construction with three-Buddha peaks
- 1992A three-count drill that binds candlesticks, head and shoulders, and entry rules
- 1997Constructing bump and run reversal channels
- 1998Testing reversal formations in bond futures
- 1999Construction first: extra shoulders, the neckline, and the diamond test
- 1999Dead-cat bounce, rollover, and failed reversals
- 1999Evaluating time gaps in bond reversal patterns
- 2000Constructing head and shoulders and double reversal patterns
- 2001Constructing broadening and complex bottoms
- 2001Constructing a slanted head-and-shoulders when the chart is tilted
- 2002Head and shoulders with dominant-cycle timing
- 2002Trendline breaks, right shoulders, and trailing stops
- 2003Confirmation tests for bearish top patterns
- 2003Commodity top hypotheses on a dollar rebound
- 2003A head-and-shoulders test during a bear rally
- 2004Pattern breakouts need a primary-trend filter
- 2004Reading candlestick closes on trendline and neckline tests
- 2004Candle diagnosis needs Western targets and stops
- 2004Head-and-shoulders neckline construction
- 2005A familiar chart condition is a hypothesis, not a completed decision
- 2005A 50-day ceiling and a rising-floor stalemate
- 2006A complete trading plan from philosophy to checklist
- 2006Thin-market head and shoulders with two averages and MACD confirmation
- 2010Head and shoulders as a playback-tested setup
- 2011Turning a head-and-shoulders outline into a breakout hypothesis
- 2011Volume-confirmed head and shoulders on AIG and Citigroup in 2007
- 2013Constructing head-and-shoulders milestone points
- 2013Head-and-shoulders geometry versus the filter stack
- 2013Algorithmic head-and-shoulders construction
- 2018International relative strength as a double-top case study
- 2019Structure invalidation before comfort-stops