1991issue C021-4
The journal as one checklist for taken and skipped trades
The archive journal is a written record of the reasoning behind each decision, later reviewed across winning trades, losing trades, and setups that were never entered. Editorial reading: score a head-and-shoulders hypothesis and the urge to stand aside on the same pre-trade checklist.
- A journal records the reasoning behind each decision so later review can reinforce the thought process that accompanied favorable outcomes.
- After the writing habit exists, the page holds a technical review with trade, stop, and result notes, a forecast log, and a research parking lot.
- Skipped trades are attributed mainly to emotional postponement after losses, while the market is still watched and ideas are still tested without capital.
- A journal audit rereads written forecasts, taken trades, and untraded setups and grades past ideas as on-target, close, or wrong.
A written record of each decision
Easy early gains in a strong advance, often with wide or unused stops, are framed as a path that can install habits later reversed by the market.
A journal is presented as a written record of the reasoning behind each decision so later review can reinforce the thought process that accompanied favorable outcomes.
If directional forecasting never develops, applying the same indicators the same way is offered as another route toward a stable decision style.
Three parts once the habit exists
Journal frequency is matched to horizon. Session-by-session notes are used when timing depends on each day. Weekend notes are used when the outlook is longer-term.
After the writing habit exists, the journal is specified as three parts. The first is a consistent technical review plus trade, stop, and result notes. The second is a forecast log, a written directional call plus its rationale, kept so later review can separate repeatable process from one-off guesses. The third is a research parking lot, notes of untested pattern or indicator ideas captured during live work for later study rather than immediate use.
A short indicator scorecard marked plus, neutral, or minus, then netted, is offered as a way to collapse mixed readings into one stance. The indicator scorecard is that short tool list marked positive, neutral, or negative so mixed readings can be totaled into one stance.
Score the chart and the stand-aside on one page
An example entry treats a completed three-session head-and-shoulders support, volume context, and a scored indicator panel as one hypothesis about whether a new high would hold.
Head-and-shoulders support is a three-swing price structure whose completed right shoulder is treated as a falsifiable hypothesis about whether support will hold. Editorial reading: that chart call belongs on the same pre-trade checklist that records market state, rule inputs, stop placement, and whether the setup will be taken or skipped.
Hartle's 9 November 1990 bond-market scorecard
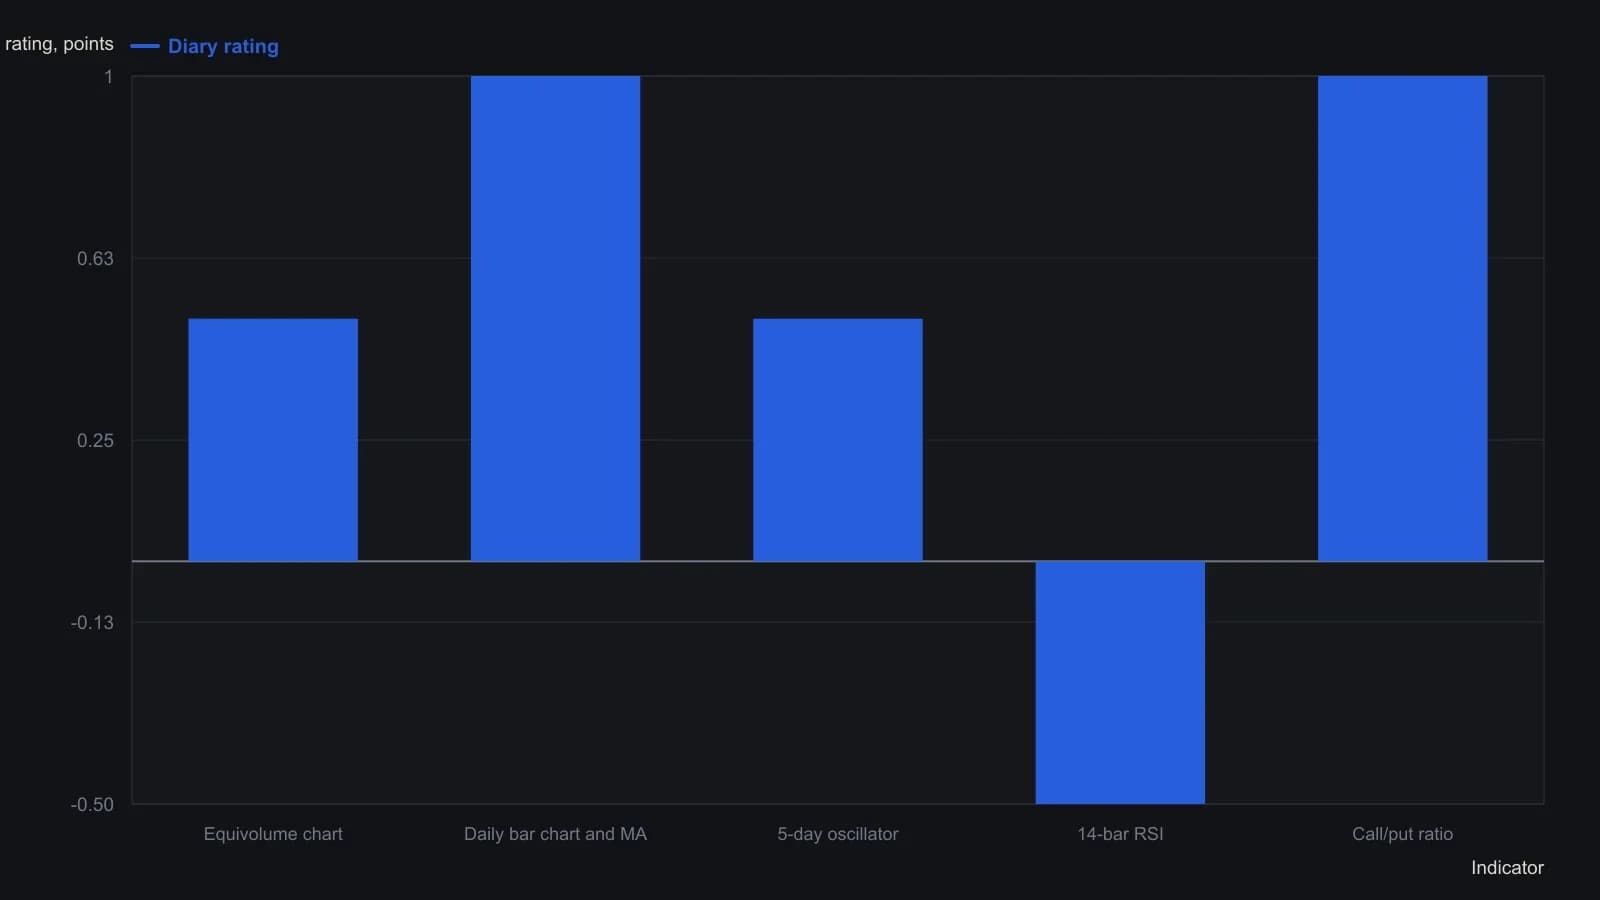
Hartle scored each tool +, o, or − and allowed a half-scale by pairing a sign with neutral. Mapped here as + = 1, +,0 = 0.5, −,0 = −0.5. Net +2.5 is their sum, not a sixth indicator.
Skipped trades in the same review
After-the-fact review is specified to include winning trades, losing trades, and setups that were never entered.
Skipped trades are attributed mainly to emotional strain after losses, including postponing new risk while still watching the market and testing ideas in real time. That pattern is emotional postponement: the tendency, after losses, to delay new entries while still watching the market and testing ideas without capital.
Reread the page against the market
A journal audit is a later review of written forecasts, taken trades, and untraded setups against what the market actually did.
A periodic reread is used to grade past ideas as on-target, close, or wrong and to keep self-criticisms of process errors in view.
All readings on this track · 37 readings
- 1982Head and shoulders as a three-path completion test
- 1984Stock low clusters as a cycle baseline
- 1985Four-phase construction of the head-and-shoulders reversal
- 1989Volume-confirmed reversal patterns, stops, and measured objectives
- 1991The journal as one checklist for taken and skipped trades
- 1991Head and shoulders as a direction hypothesis
- 1991Candlestick body and shadow construction with three-Buddha peaks
- 1992A three-count drill that binds candlesticks, head and shoulders, and entry rules
- 1997Constructing bump and run reversal channels
- 1998Testing reversal formations in bond futures
- 1999Construction first: extra shoulders, the neckline, and the diamond test
- 1999Dead-cat bounce, rollover, and failed reversals
- 1999Evaluating time gaps in bond reversal patterns
- 2000Constructing head and shoulders and double reversal patterns
- 2001Constructing broadening and complex bottoms
- 2001Constructing a slanted head-and-shoulders when the chart is tilted
- 2002Head and shoulders with dominant-cycle timing
- 2002Trendline breaks, right shoulders, and trailing stops
- 2003Confirmation tests for bearish top patterns
- 2003Commodity top hypotheses on a dollar rebound
- 2003A head-and-shoulders test during a bear rally
- 2004Pattern breakouts need a primary-trend filter
- 2004Reading candlestick closes on trendline and neckline tests
- 2004Candle diagnosis needs Western targets and stops
- 2004Head-and-shoulders neckline construction
- 2005A familiar chart condition is a hypothesis, not a completed decision
- 2005A 50-day ceiling and a rising-floor stalemate
- 2006A complete trading plan from philosophy to checklist
- 2006Thin-market head and shoulders with two averages and MACD confirmation
- 2010Head and shoulders as a playback-tested setup
- 2011Turning a head-and-shoulders outline into a breakout hypothesis
- 2011Volume-confirmed head and shoulders on AIG and Citigroup in 2007
- 2013Constructing head-and-shoulders milestone points
- 2013Head-and-shoulders geometry versus the filter stack
- 2013Algorithmic head-and-shoulders construction
- 2018International relative strength as a double-top case study
- 2019Structure invalidation before comfort-stops