2003issue C121-4
Commodity top hypotheses on a dollar rebound
Editorial frame: when a reserve-currency rebound is only a working idea, treat gold and crude strength as a three-part classroom drill. The archive first read foreign currencies through a head-and-shoulders top, restated gold and crude rallies as tests of early-2003 prior peaks, and presented nearby stop-sell orders as the bound on a commodity-bull hypothesis.
- Financial currencies versus the dollar were first read through a head-and-shoulders top, after which the Australian and Canadian dollars were also read as topping structures, so a dollar rebound stayed a working idea tied to weaker foreign currencies and a rise in long-term yields.
- Gold futures well above 380 and crude futures above 31 were treated as the early-2003 extremes. Only a failure to exceed those highs would treat secondary peaks about six months later as marking a dollar low.
- Crude’s break from a five-week rising channel into a symmetrical triangle, a July-June negative divergence, and gold’s still-corrective structure below the January area above 387 kept each commodity advance as a test, not a confirmed bull trend.
- If gold moved above 400 while the dollar index held above its June area just under 93, nearby stop-sell orders, not the popularity of a commodity story, were presented as the bound on the hypothesis.
A foreign-currency topping analogue
Financial currencies versus the dollar were described as breaking first through a head-and-shoulders top. That three-peak topping analogue, a central high flanked by two lower highs, was the repeatable foreign-currency condition used to state a reversal hypothesis against the dollar. The Australian and Canadian dollars were then also read as forming topping structures.
The US Dollar Index was described as falling from 122 in early 2001 to as low as 93 in spring 2003. The later rebound case was tied to those weaker foreign currencies and a rise in long-term yields. After earlier extremes at 165 and 80, the dollar itself was placed in a comfort band from 100 to 90.
Commodity rallies as prior-peak tests
Early-2003 extremes, gold futures well above 380 and crude futures above 31, were distinguished from secondary peaks about six months later. Only a failure to exceed those earlier highs would treat the summer peaks as marking a dollar low.
Editorial note: restating each commodity rally as a prior-peak resistance test keeps the dollar-low idea alive only while those earlier highs hold. A later print that clears the first extreme would invalidate that hypothesis rather than merely delay it.
Crude after the five-week channel
September crude was described as rising from below 24 in November 2002 to above 31 by late February 2003, then falling below 25 in mid-April before returning above 31 by early July. By late July 2003, crude was described as having broken a five-week rising channel into a symmetrical triangle. The newer peak was about 20 cents below the February high, so that prior peak was treated as resistance.
A trend channel is a pair of parallel lines around an advance or decline. Its break changes the working structure from trend to consolidation or reversal test. A symmetrical triangle is a contracting range between converging trendlines that can resolve either way, and completion depends on the boundaries holding while the range shrinks.
Crude’s July price peak was described as higher than its June peak, while the corresponding MACD peaks did the reverse. That negative divergence, a higher price peak that fails to print a higher reading on a momentum overlay, was used to question whether the higher high was confirmed.
Gold still below the January area
December gold was described as peaking at 387.50 in early February 2003 and bottoming at 321.30 in early April, then making a May lower high at 376 after a slide from 376 toward 343. The structure was treated as still corrective until price cleared the January area above 387.
After gold broke a nine-week declining channel, the channel top and a short-term average were the support tests that would keep an advance hypothesis intact. An extended channel was also contrasted with a flag that typically lasts no more than three weeks.
A possible weekly symmetrical triangle in gold was described as about 60 from high to low and still needing range contraction below 20, versus a then-current range near 28. A break near 360 was associated with a 420 measured objective, and a downside break with a test near 300.
December gold still below the February 2003 peak
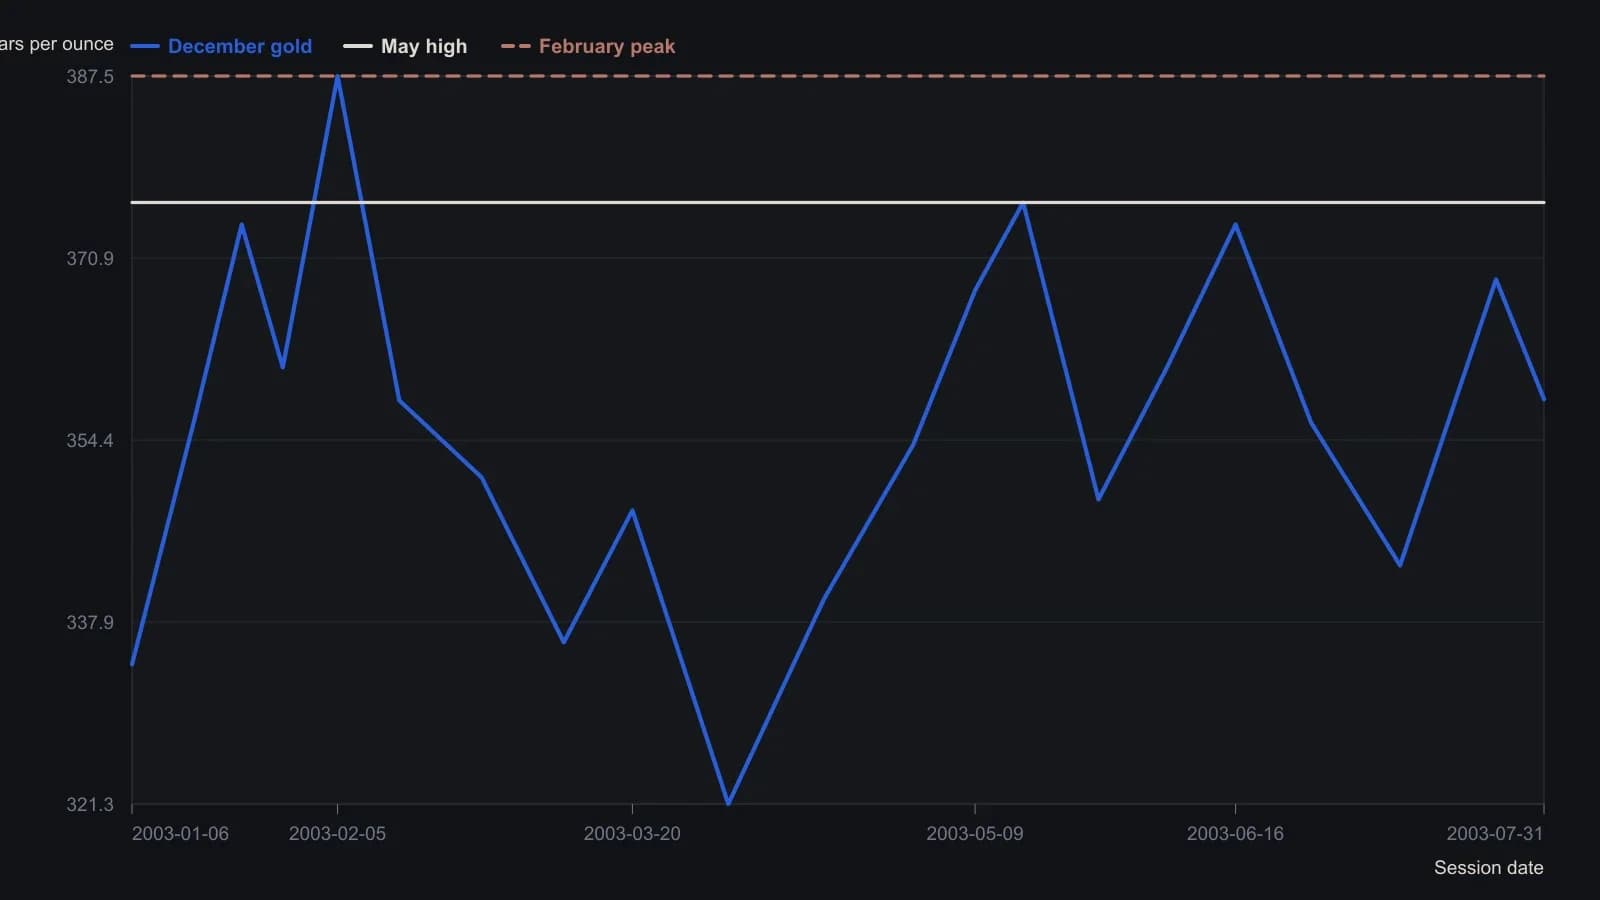
December 2003 COMEX contract (GCZ03). Intermediate closes are approximate to about a dollar on the daily pane. The February high, April low, May high, and session close are exact figures from the article and the quote header, not raster guesses.
Stops that bound the commodity-bull hypothesis
If gold moved above 400 while the dollar index held above its June area just under 93, nearby stop-sell orders were presented as the bound on the commodity-bull hypothesis. The stop-loss is a prewritten exit that bounds the loss if price invalidates the chart hypothesis, rather than if a commodity story remains popular.
Editorial reading: write that stop before the next high can rescue the narrative. The archive presented the nearby exits as the bound. It did not treat a popular commodity story as a reason to stay.
All readings on this track · 37 readings
- 1982Head and shoulders as a three-path completion test
- 1984Stock low clusters as a cycle baseline
- 1985Four-phase construction of the head-and-shoulders reversal
- 1989Volume-confirmed reversal patterns, stops, and measured objectives
- 1991The journal as one checklist for taken and skipped trades
- 1991Head and shoulders as a direction hypothesis
- 1991Candlestick body and shadow construction with three-Buddha peaks
- 1992A three-count drill that binds candlesticks, head and shoulders, and entry rules
- 1997Constructing bump and run reversal channels
- 1998Testing reversal formations in bond futures
- 1999Construction first: extra shoulders, the neckline, and the diamond test
- 1999Dead-cat bounce, rollover, and failed reversals
- 1999Evaluating time gaps in bond reversal patterns
- 2000Constructing head and shoulders and double reversal patterns
- 2001Constructing broadening and complex bottoms
- 2001Constructing a slanted head-and-shoulders when the chart is tilted
- 2002Head and shoulders with dominant-cycle timing
- 2002Trendline breaks, right shoulders, and trailing stops
- 2003Confirmation tests for bearish top patterns
- 2003Commodity top hypotheses on a dollar rebound
- 2003A head-and-shoulders test during a bear rally
- 2004Pattern breakouts need a primary-trend filter
- 2004Reading candlestick closes on trendline and neckline tests
- 2004Candle diagnosis needs Western targets and stops
- 2004Head-and-shoulders neckline construction
- 2005A familiar chart condition is a hypothesis, not a completed decision
- 2005A 50-day ceiling and a rising-floor stalemate
- 2006A complete trading plan from philosophy to checklist
- 2006Thin-market head and shoulders with two averages and MACD confirmation
- 2010Head and shoulders as a playback-tested setup
- 2011Turning a head-and-shoulders outline into a breakout hypothesis
- 2011Volume-confirmed head and shoulders on AIG and Citigroup in 2007
- 2013Constructing head-and-shoulders milestone points
- 2013Head-and-shoulders geometry versus the filter stack
- 2013Algorithmic head-and-shoulders construction
- 2018International relative strength as a double-top case study
- 2019Structure invalidation before comfort-stops