2004issue C061-3
A 50-day average touch as a screening procedure
A late-January 2004 Nasdaq Composite retracement to the 50-day moving average is treated as the moment to scan for individual names also at or near that line. The archive then keeps the pullback valid only under trend, relative-strength, momentum, and three-bar reversal checks, and uses inverted head-and-shoulders maps only as supporting structure.
- Open the watchlist only when a major composite is testing its own 50-day average, then scan for individual names at or near the same line.
- Keep the pullback valid only while relative strength stays above 50, a 14-period reading is generally below 35, and both daily and weekly charts still trend higher.
- Time entry with a three-bar reversal, place a stop below the 50-day average, and treat a close beneath that line as an exit that forces reevaluation.
- Use an inverted head-and-shoulders map only to locate the average inside a larger reversal structure, not as a substitute for the pullback, momentum, or stop rules.
An index test opens the watchlist
A late-January 2004 Nasdaq Composite retracement to the 50-day moving average is treated as the moment to scan for individual names also at or near that same average. The screening logic cites an estimate that about 75 percent of stocks rise and fall with major indexes, so an index test of the 50-day average is expected to produce many constituent pullbacks to that line.
Waiting for a major composite to test its own 50-day average before scanning individual names is the index-led screen. The 50-session exponential line both locates the pullback and marks invalidation when price closes through it.
Filters that keep a pullback valid
Pullback trading here is a ruleset that waits for an advancing name to return to the 50-day exponential average, then applies momentum, bar-reversal, and multi-timeframe trend checks before treating the dip as an entry rather than a breakdown.
The long procedure waits for a pullback to the 50-day exponential moving average while relative strength stays above 50, then times entry with a 14-period reading generally below 35 and a three-bar reversal. The fifty-fifty filter is that paired condition of a 50-day average pullback with a relative-strength reading that remains above 50.
The three-bar reversal is a short-term turn in price used as the final timing trigger after the average and oscillator conditions are already met.
Stops, skips, and preferred entries
A stop is specified below the 50-day moving average, and a close beneath that average is treated as an exit that forces reevaluation.
Candidates must trend higher on both daily and weekly charts, with preferred entries early in a new advance after consolidation or after a pullback that resumes the prior uptrend. Double tops, nearby major overhead resistance, and a weakening index backdrop are listed as reasons to skip a candidate.
Three mapped cases
One 2004 case maps a daily pullback to the 50-day average onto a 50 percent retracement from the January 21 high, together with a double bottom and a three-bar reversal.
A second case treats a January 2004 breakout after a two-month inverted head-and-shoulders, then a later coil along the 50-day average, with a weekly inverted head-and-shoulders as added structure.
A third case pairs a daily inverted head-and-shoulders with a close at the 50-day average after a January 2004 rebound from the 200-day average. The longer 200-session line appears only as extra context in that case.
In the pattern cases, the inverted three-trough price map is supporting structure around the average, not a replacement for the pullback, momentum, or stop rules.
A closing checklist
The closing checklist requires reading daily and weekly trends together and keeping general market indexes above their own 50-day averages.
ODSY daily close against the 50-day and 200-day averages
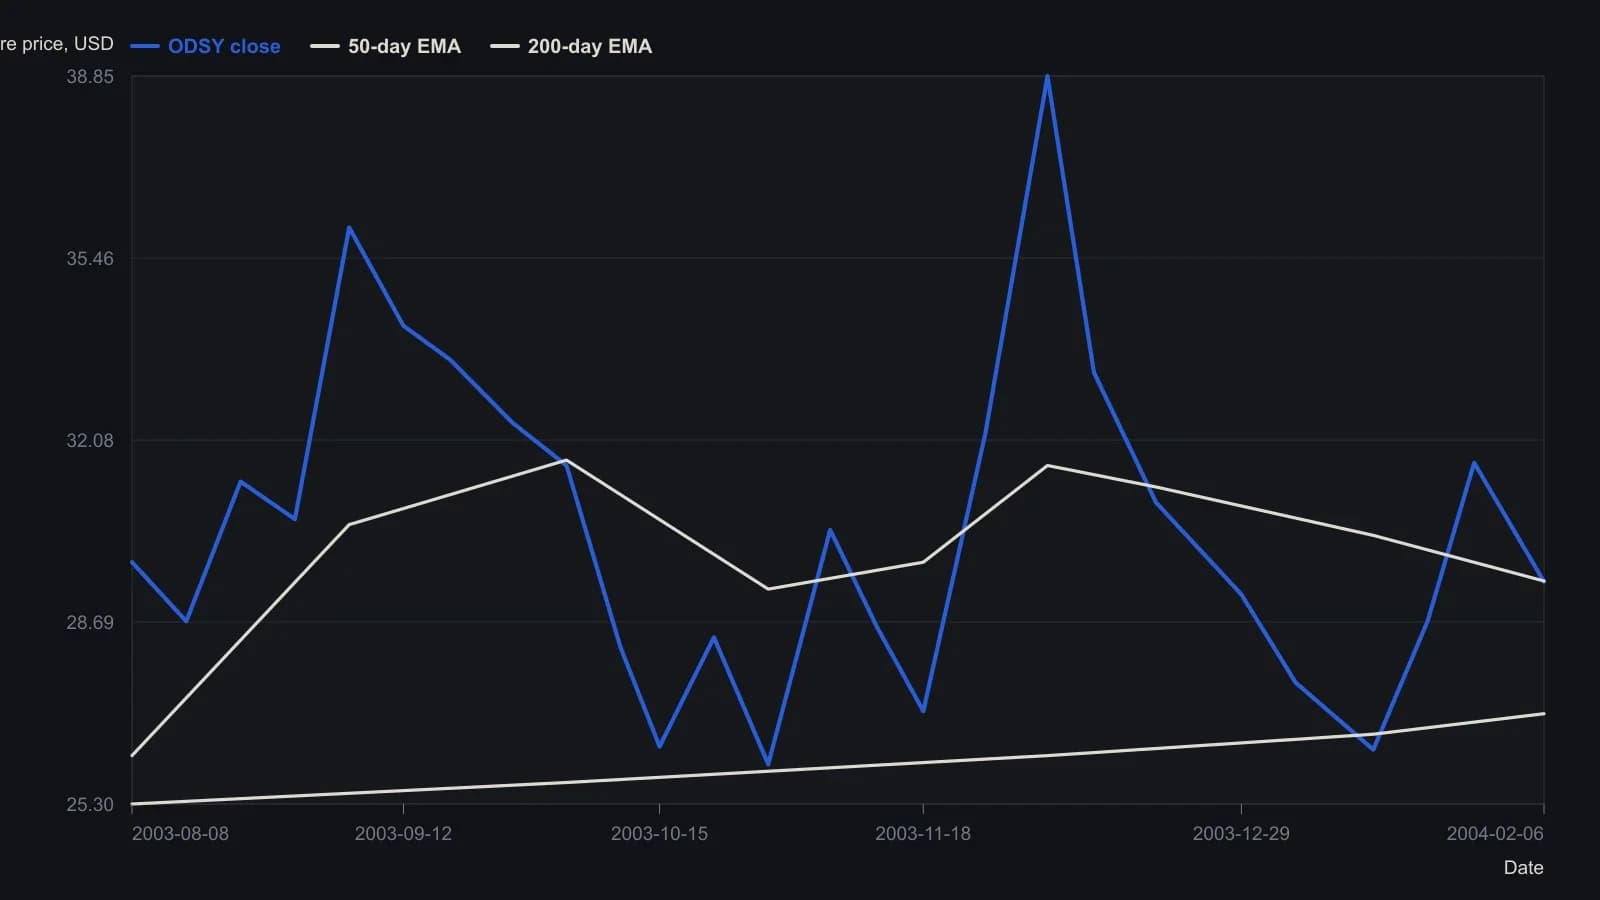
Printed labels and the 6 February 2004 OHLC/EMA header are exact. Unlabeled closes and moving-average values are visual readings from the daily raster and are only reliable to about 0.2–0.3 points.
All readings on this track · 10 readings
- 1997A two-gate held-out test of hand-labeled pullback nets
- 2004A 50-day average touch as a screening procedure
- 2005Write a moving-average pullback as one procedure
- 2005How to write a short moving-average pullback as one procedure
- 2007Failed-breakout shorts with a half-width exit
- 2008Three-gate pullback entries from exchange tick breadth
- 2010Clear-method noise alerts for swing entries and exits
- 2011Same pullback rules, different market modes
- 2012Pixel-grid pullback and sector color alignment
- 2013Untested pullback entries need quantified exits