2001issue C031-3
Swiss franc: seasonal permission and a weekly point-and-figure breakout
A historical Swiss franc case kept monthly point-and-figure as a regime map and the seasonal calendar as a directional filter. The breakout-system stayed flat until one weekly-close-trigger printed, then expressed a long with six-month at-the-money calls and a premium-loss invalidation.
- Monthly point-and-figure only mapped the Swiss franc decline, four congestion areas, and support at 5800. It did not open the trade.
- Seasonal-trading treated a long signal in September as permitted and allowed shorts only in the January-June window. The calendar never replaced the price trigger.
- The breakout-system stayed flat unless March 2001 Swiss franc futures printed a 6300 weekly close. A 5700 weekly close argued against a bullish setup.
- A weekly close through a major downtrend line near 62 to 63 was an earlier alternative that carried a higher false-breakout risk than waiting for 6300.
Three jobs, one weekly permission
The teaching job is to keep three jobs apart. Point-and-figure is a box-and-reversal price chart built from closes rather than calendar bars. On the monthly scale it only mapped the regime: support, congestion, and the shape of the decline. Seasonal-trading only granted or withheld a long or short bias from typical time-of-year highs and lows. The breakout-system stayed flat until a single weekly-close-trigger fired.
A weekly-close-trigger depends on the week finishing beyond a stated price, not on an intraday poke through that price. Until that close printed, the historical procedure took no position.
A cotton sketch of the same wait
A prior cotton illustration of the same long-horizon procedure treated a weekly point-and-figure close at 5500 as the long trigger. After that print, price later reached about 6300. The Swiss franc case reused that wait-for-the-weekly-close idea. The cotton sketch supplied the procedure, not a Swiss franc entry.
Monthly point-and-figure as the regime map
The monthly Swiss franc point-and-figure chart framed a decline from 8900 to 5800. That decline contained four congestion areas and a five-wave structure, with major support marked at 5800. Congestion here means a sideways cluster of point-and-figure activity counted as a pause inside the larger trend, used to judge whether the decline might be terminating.
A 50 percent retracement of that monthly decline was mapped to about 7400 as a retracement-waypoint if a durable bottom formed. A retracement-waypoint is a measured structural reference taken from a completed decline. It mapped how far a countertrend advance might travel if the range broke. It was not an entry.
Seasonal-trading as a directional filter
The yearly Swiss franc seasonal template placed typical lows in the June-July window and typical highs in January. Seasonal-trading used that template as a directional filter rather than a standalone entry. Under that filter, a long signal in September was treated as seasonally permitted. Short trades were treated as valid only in the January-June window. The calendar could withhold a side. It could not fire the trade.
The weekly-close-trigger that could leave flat
The weekly point-and-figure chart defined a 6300 weekly close as the long trigger and a 5700 weekly close as the print that would argue against a bullish setup. An alternative long trigger was a weekly close through a major downtrend line near 62 to 63. That print was accepted as an earlier entry that carried a higher false-breakout risk than waiting for 6300.
The historical procedure stayed flat unless the March 2001 Swiss franc futures printed a 6300 weekly close. That stay-flat rule is the breakout-system: enter only after a predefined weekly close clears a box level or trendline, and otherwise take no position.
How a triggered long was held
A triggered long was then expressed with six-month at-the-money calls. The long was invalidated at a 30 percent loss of premium. Editorial. The 7400 retracement-waypoint remains a map, not a reason to buy before the 6300 weekly close.
December Swiss franc seasonal index, 1991–2000
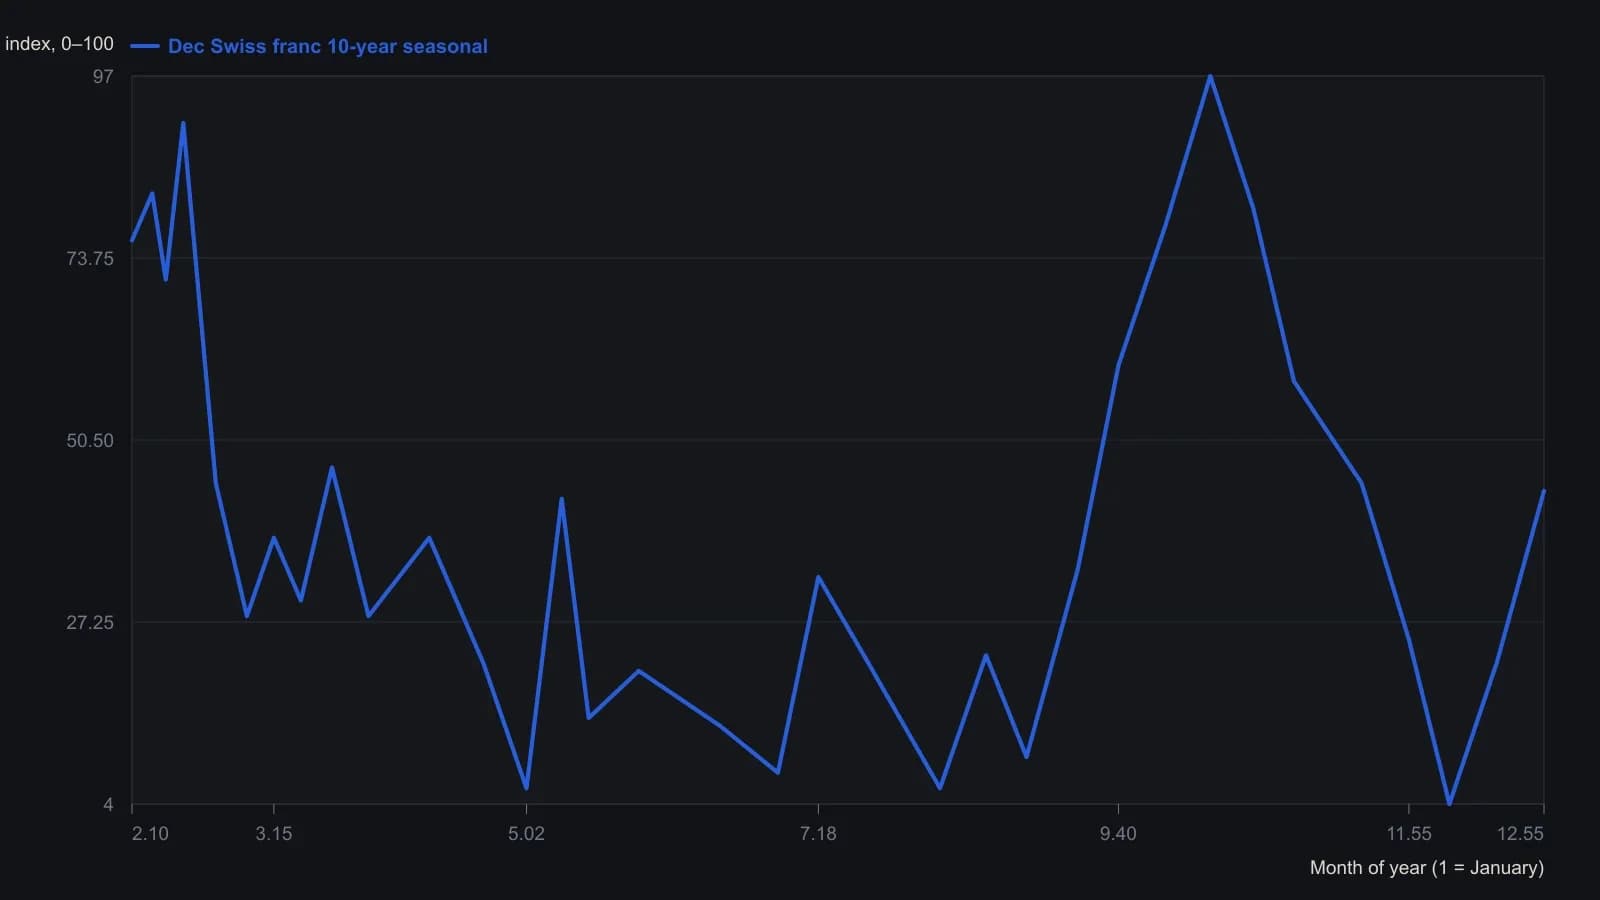
Y-values are digitized from a small raster to the nearest few index points on a 0–100 scale and are not exact prints. The source plot is blank in January. Zupans states the filter as long June–September and short January–June; this 1991–2000 window’s dominant high is early October.
All readings on this track · 30 readings
- 1988Constructing trend definitions with filters and lines
- 1989Reversal count as the clock on point-and-figure charts
- 1989Point-and-figure setup and session-average entry windows
- 1989Two-scale point-and-figure trendlines and stop placement
- 1989Adjusted net asset value, tighter reversals, and written stops on a fund point-and-figure chart
- 1990Stack option odds after point-and-figure signals
- 1991Constructing a point-and-figure downtrend-break
- 1991Constructing point-and-figure box and reversal charts
- 1991Constructing a close-tested one-two ladder on a point-and-figure chart
- 1992Point-and-figure, breadth, and volume as falsifiable hypotheses
- 1992Three-gate stock selection with ranks and point and figure
- 1993Constructing combined stochastics and point-and-figure relative strength
- 1997Point-and-figure box scale and reversal construction
- 2000Cotton weekly point-and-figure: late-stage decline, named weekly close
- 2000Constructing point-and-figure charts for support, resistance, and breakouts
- 2001Swiss franc: seasonal permission and a weekly point-and-figure breakout
- 2001Constructing point-and-figure boxes and reversals
- 2002Point-and-figure construction: box, live column, and three-box reversal
- 2003E-mini point-and-figure box-size and a descending-triangle breakout
- 2003A reconstruction critique of point-and-figure daytrading
- 2004Point-and-figure column moving-average crossovers
- 2005Box-series transforms for trend and channel work
- 2006Constructing bearish point-and-figure support breaks
- 2008Point-and-figure forex breakouts and triangles
- 2012From tactile charts to written trade rules
- 2013Combine a Point and figure chart and Moving-average crossover inside one System optimization procedure
- 2015Point-and-figure time and volume limits are conventions to test
- 2016Measurement-first critique of indicator defaults
- 2017Point-and-figure construction, reversals, and column-based overlays
- 2019A 2019 charting case as a three-check trend classroom