2000issue C051-4
Cotton weekly point-and-figure: late-stage decline, named weekly close
The cotton sheet mapped a nearly five-year slide from about 1.16 dollars per pound to a low near 0.49, then counted four weekly congestions so further downside looked late-stage. A long still waited for a weekly close through the 0.49 to 0.54 base, a first horizontal-count from that base, and a stop-loss written before any capital was committed.
- Four weekly congestions made further cotton downside late-stage, but cheap near a support shelf was still only a map, not a long.
- Point-and-figure accumulation and distribution templates treated a break of a solidly built range as the entry, not the congestion itself.
- A long was conditioned on a weekly close through the 0.49 to 0.54 base, above 0.54 or 0.55, after which a six-box base times three added to the 0.49 low projected a first count of 0.67.
- Stops were specified before entry as a 30 percent or 40 percent loss of option premium, or as an 80 percent drawdown of original futures margin.
Map the decline, then withhold the trade
The cotton case mapped a nearly five-year decline from about 1.16 dollars per pound to a low near 0.49 on monthly bars and weekly point-and-figure charts. Point-and-figure is a scale-based chart that drops time and records only reversals of a chosen box size, turning open-high-low-close structure into columns that isolate congestion and the close that would confirm a move.
Monthly cotton back to 1981, recast as a 4-by-12 point-and-figure chart, placed a major support shelf near 0.50 to 0.53 dollars per pound, described as close to production cost. Editorial reading: proximity to that shelf can make the commodity look cheap. The rest of the sheet is about whether a reversal is actually being traded.
Monthly cotton from the 1995 high into the 1999–2000 base
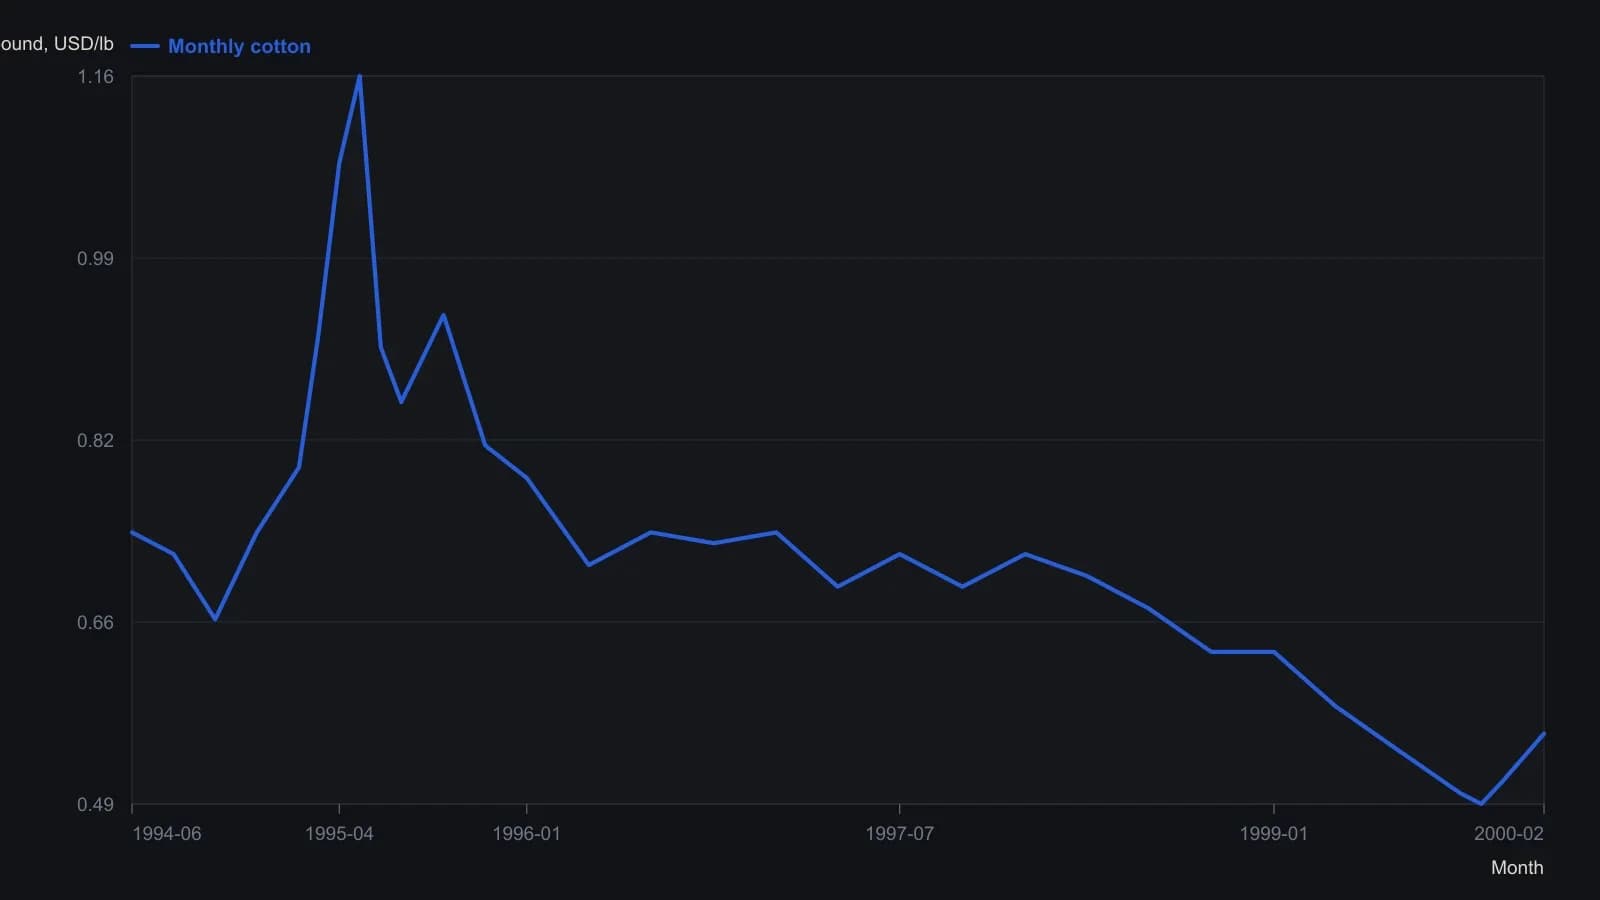
Monthly bars were read from the raster to the nearest cent except the labeled last print of 55.47 cents. The sheet is a 30-minute-delayed CQG monthly view, not a table of official settlements.
Count four congestions on the weekly sheet
The working model expected four congestion pauses in a major monthly trend, while noting that three or five can appear. That four-stage-trend reading treats a major advance or decline as typically passing through four congestion pauses before late-stage reversal setups are considered. Congestion is a stretch of trading confined to a narrow band; here the bands are counted across the monthly trend to judge whether a decline is still early or already late-stage.
Weekly point-and-figure cotton was marked with four congestion levels, so further downside was treated as late-stage rather than an early-trend short. Editorial reading: late-stage locates the decline on the sheet. It does not replace the breakout rule.
Name the weekly close through the base
Weekly point-and-figure accumulation and distribution templates treated a break of a solidly built range as the long or short entry, not the congestion itself. A breakout is a weekly close through the top or bottom of that well-built range. It converts a mapped congestion into a long or short signal instead of a guess at the exact low or high.
A half retracement of the full decline was sketched near 0.85 dollars per pound. A long was conditioned on a weekly close through the 0.49 to 0.54 dollar base, above 0.54 or 0.55.
Add the first horizontal-count only after that close
If cotton closed above 0.55 on a weekly basis, a six-box base times three, eighteen boxes, added to the 0.49 low projected a first count of 0.67. A horizontal-count multiplies the width of a completed base by a fixed factor and adds that distance to the low to sketch a first objective after a confirmed breakout.
Editorial reading: the count is attached to the confirmed weekly close, not to the earlier judgment that cotton looked cheap near production cost.
Write the stop-loss before any entry
Stops were specified before entry as a 30 percent loss of option premium, with 40 percent also stated, or as an 80 percent drawdown of original futures margin. A stop-loss is a precommitted loss bound, stated as a share of option premium or of original futures margin, that keeps the invalidation level decided before entry and throughout the hold.
Editorial reading: the stop is part of the hypothesis. If that bound is hit, the reversal idea is finished, whether or not the commodity still looks cheap.
A later note recorded the named weekly close
A mid-February 2000 editorial note recorded that cotton had printed the described weekly close at 0.55 dollars. The archive workflow stops at that confirmation print. It does not report later prices, fills, or results.
All readings on this track · 30 readings
- 1988Constructing trend definitions with filters and lines
- 1989Reversal count as the clock on point-and-figure charts
- 1989Point-and-figure setup and session-average entry windows
- 1989Two-scale point-and-figure trendlines and stop placement
- 1989Adjusted net asset value, tighter reversals, and written stops on a fund point-and-figure chart
- 1990Stack option odds after point-and-figure signals
- 1991Constructing a point-and-figure downtrend-break
- 1991Constructing point-and-figure box and reversal charts
- 1991Constructing a close-tested one-two ladder on a point-and-figure chart
- 1992Point-and-figure, breadth, and volume as falsifiable hypotheses
- 1992Three-gate stock selection with ranks and point and figure
- 1993Constructing combined stochastics and point-and-figure relative strength
- 1997Point-and-figure box scale and reversal construction
- 2000Cotton weekly point-and-figure: late-stage decline, named weekly close
- 2000Constructing point-and-figure charts for support, resistance, and breakouts
- 2001Swiss franc: seasonal permission and a weekly point-and-figure breakout
- 2001Constructing point-and-figure boxes and reversals
- 2002Point-and-figure construction: box, live column, and three-box reversal
- 2003E-mini point-and-figure box-size and a descending-triangle breakout
- 2003A reconstruction critique of point-and-figure daytrading
- 2004Point-and-figure column moving-average crossovers
- 2005Box-series transforms for trend and channel work
- 2006Constructing bearish point-and-figure support breaks
- 2008Point-and-figure forex breakouts and triangles
- 2012From tactile charts to written trade rules
- 2013Combine a Point and figure chart and Moving-average crossover inside one System optimization procedure
- 2015Point-and-figure time and volume limits are conventions to test
- 2016Measurement-first critique of indicator defaults
- 2017Point-and-figure construction, reversals, and column-based overlays
- 2019A 2019 charting case as a three-check trend classroom