2001issue C041-4
Constructing point-and-figure boxes and reversals
Point-and-figure posts an advance as Xs and a decline as Os, never in the same column, and only after a full box is covered. Editorial: lock box size and a three-box reversal first so later support, resistance, and pattern reads are consequences of those two scale choices.
- Box size and a three-box reversal are chosen first; a mark is posted only after price covers a full box.
- An x-column records an advance and an o-column records a decline; the two marks never occupy the same column.
- A new column starts only after price swings at least three boxes; a smaller counter-move leaves the current column unchanged.
- The finished chart has no time axis. After the columns exist, a bullish support line and a bearish resistance line are drawn at 45 degrees from the posted extremes.
Two choices decide what can be posted
A point-and-figure chart posts price only after a full box is covered and starts a new column only after a stated reversal. Box size is the minimum price increment required to add one X or one O. The three-box reversal is the minimum opposite move, counted in boxes, that starts a new column of the opposite mark.
A 1x3-scale uses a one-unit box and a three-box reversal threshold. In a 1x3 construction the box is $1 and a new column starts only after a three-box reversal.
Alternating columns of Xs and Os
An advance is posted as an x-column and a decline as an o-column. The two marks never occupy the same column. A change from one column type to the other is posted only after price swings at least three boxes.
With $1 boxes, an x-column topped at $50 requires a move to $47 before Os begin, and an o-column bottomed at $45 requires a rally to $48 before Xs begin.
Incomplete boxes stay off the grid
A box is filled only after price covers its entire value. Leftover fractions are not posted. A counter-move smaller than the reversal size leaves the current column unchanged.
Scale is a choice and time is not the plot
One common scale posts $1 per box below $100 and $2 per box above $100, though box size remains the analyst's choice.
The finished chart has no time axis. Time may be annotated on the grid, but the plot itself records only supply and demand.
Support and resistance lines follow the columns
After an apparent low, a bullish support line is drawn from directly below the lowest O in the lowest column and rises at 45 degrees. A bearish resistance line is drawn from the highest X in the highest column and falls at 45 degrees.
Editorial: those 45-degree lines rest on the posted extremes. Change the box size or the reversal threshold and the columns, the extremes, and the lines can change with them.
Analog Devices: price versus the 55 floor and the 45-degree lines
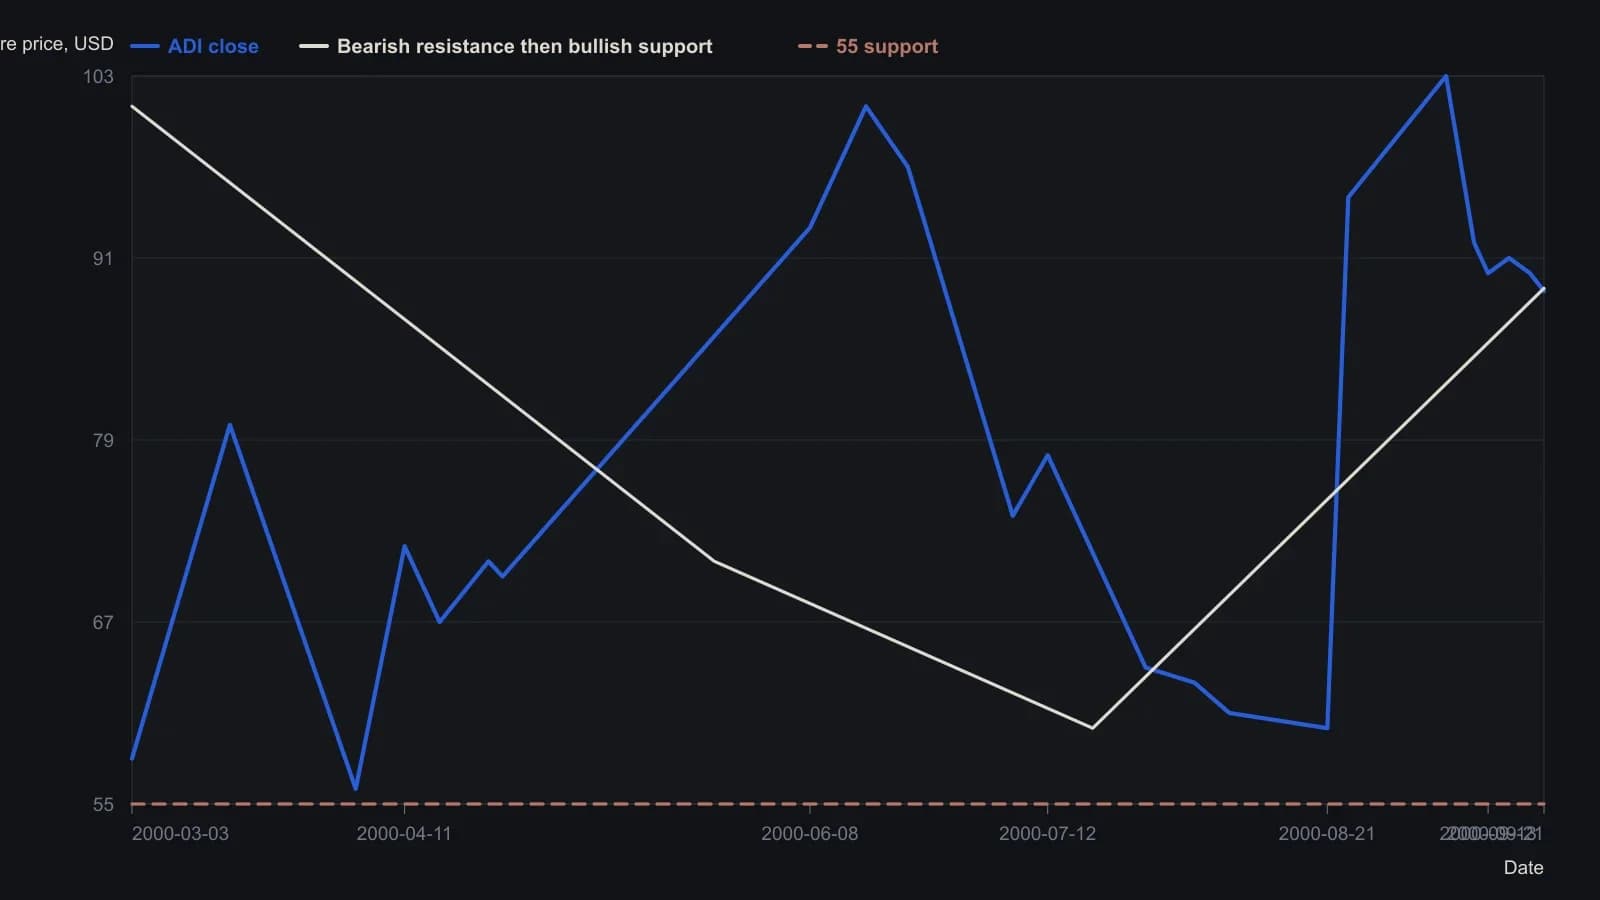
The plot header fixes a $1 box and a three-box reversal on daily high/low (1.00×3.00 D-H/L). Closes are digitized to the nearest dollar except the final printed print of 88.81. The raster does not print a year; 2000 is inferred from the April 2001 issue date and a March–September axis.
All readings on this track · 30 readings
- 1988Constructing trend definitions with filters and lines
- 1989Reversal count as the clock on point-and-figure charts
- 1989Point-and-figure setup and session-average entry windows
- 1989Two-scale point-and-figure trendlines and stop placement
- 1989Adjusted net asset value, tighter reversals, and written stops on a fund point-and-figure chart
- 1990Stack option odds after point-and-figure signals
- 1991Constructing a point-and-figure downtrend-break
- 1991Constructing point-and-figure box and reversal charts
- 1991Constructing a close-tested one-two ladder on a point-and-figure chart
- 1992Point-and-figure, breadth, and volume as falsifiable hypotheses
- 1992Three-gate stock selection with ranks and point and figure
- 1993Constructing combined stochastics and point-and-figure relative strength
- 1997Point-and-figure box scale and reversal construction
- 2000Cotton weekly point-and-figure: late-stage decline, named weekly close
- 2000Constructing point-and-figure charts for support, resistance, and breakouts
- 2001Swiss franc: seasonal permission and a weekly point-and-figure breakout
- 2001Constructing point-and-figure boxes and reversals
- 2002Point-and-figure construction: box, live column, and three-box reversal
- 2003E-mini point-and-figure box-size and a descending-triangle breakout
- 2003A reconstruction critique of point-and-figure daytrading
- 2004Point-and-figure column moving-average crossovers
- 2005Box-series transforms for trend and channel work
- 2006Constructing bearish point-and-figure support breaks
- 2008Point-and-figure forex breakouts and triangles
- 2012From tactile charts to written trade rules
- 2013Combine a Point and figure chart and Moving-average crossover inside one System optimization procedure
- 2015Point-and-figure time and volume limits are conventions to test
- 2016Measurement-first critique of indicator defaults
- 2017Point-and-figure construction, reversals, and column-based overlays
- 2019A 2019 charting case as a three-check trend classroom