2017issue C1234-38
Point-and-figure construction, reversals, and column-based overlays
Point-and-figure construction starts with box size and reversal so the chart records only decisive price movement. Column moving averages and on-balance volume can then sit on that same grid, or they can put calendar time back onto a chart that otherwise ignores it.
- A point-and-figure chart advances only when price fills the chosen box increment, so a quiet market leaves the chart unchanged because time is not a plotting axis.
- One-box reversal charts are more sensitive and can show rises and falls inside a single three-box column; three-box reversal is used for a longer-term reading of trend and targets.
- Moving averages and related oscillators can be counted across columns rather than calendar days, and an on-balance volume line can be built from volume in each X or O column.
- A double-top buy is constructed when an X column exceeds a prior X-column high, and those pattern signals are read only in the direction of the prevailing trend.
What the chart records
A point-and-figure chart advances only when price fills the chosen box increment. If the market is quiet, the chart does not move, because time is not a plotting axis.
Unlike a bar or candle chart, a point-and-figure column does not display the high-low range of a session. It records a close or a high or a low at the end of the chosen interval, never both extremes as a range.
Modern construction uses a column of Xs while price is rising and Os while price is falling, so the active column itself states whether buyers or sellers currently control the move.
Box size and reversal
Box size is the price increment that must be filled before a new mark is added. It can be a fixed amount or a percentage on a log scale. Box size may also be set with a volatility measure such as standard deviation or average true range so the increment roughly matches the instrument being plotted.
One-box reversal charts change direction after a single-box reversal and are more sensitive. Three-box reversal charts were historically derived from them to give a longer-term view, and a one-box chart can show rises and falls that sit inside a single three-box column.
Three-box reversal analysis is described as objective for targets and trends, while one-box reversal interpretation is described as subjective. The historical workflow used three-box charts as the main analysis and kept a one-box chart as a more sensitive companion.
Column moving averages and on-balance volume
Construction can attach moving averages to columns rather than calendar days, then compute column-based MACD, RSI, directional movement, or Bollinger Bands from those column values.
Volume can be shown per column or horizontally per price level. An on-balance volume line can be drawn from the volume in each X and O column to read accumulation or distribution on the same grid.
Trendlines and the double-top buy
On a log-scale daily point-and-figure chart, 45-degree trendlines and a target were presented as an objective medium- to long-term construction.
A double-top buy is constructed when an X column exceeds a prior X-column high. Exceeding more than one prior column yields a stronger triple or quadruple top. Such pattern signals are read only in the direction of the prevailing trend.
S&P 500 daily 1% × 3-box point-and-figure
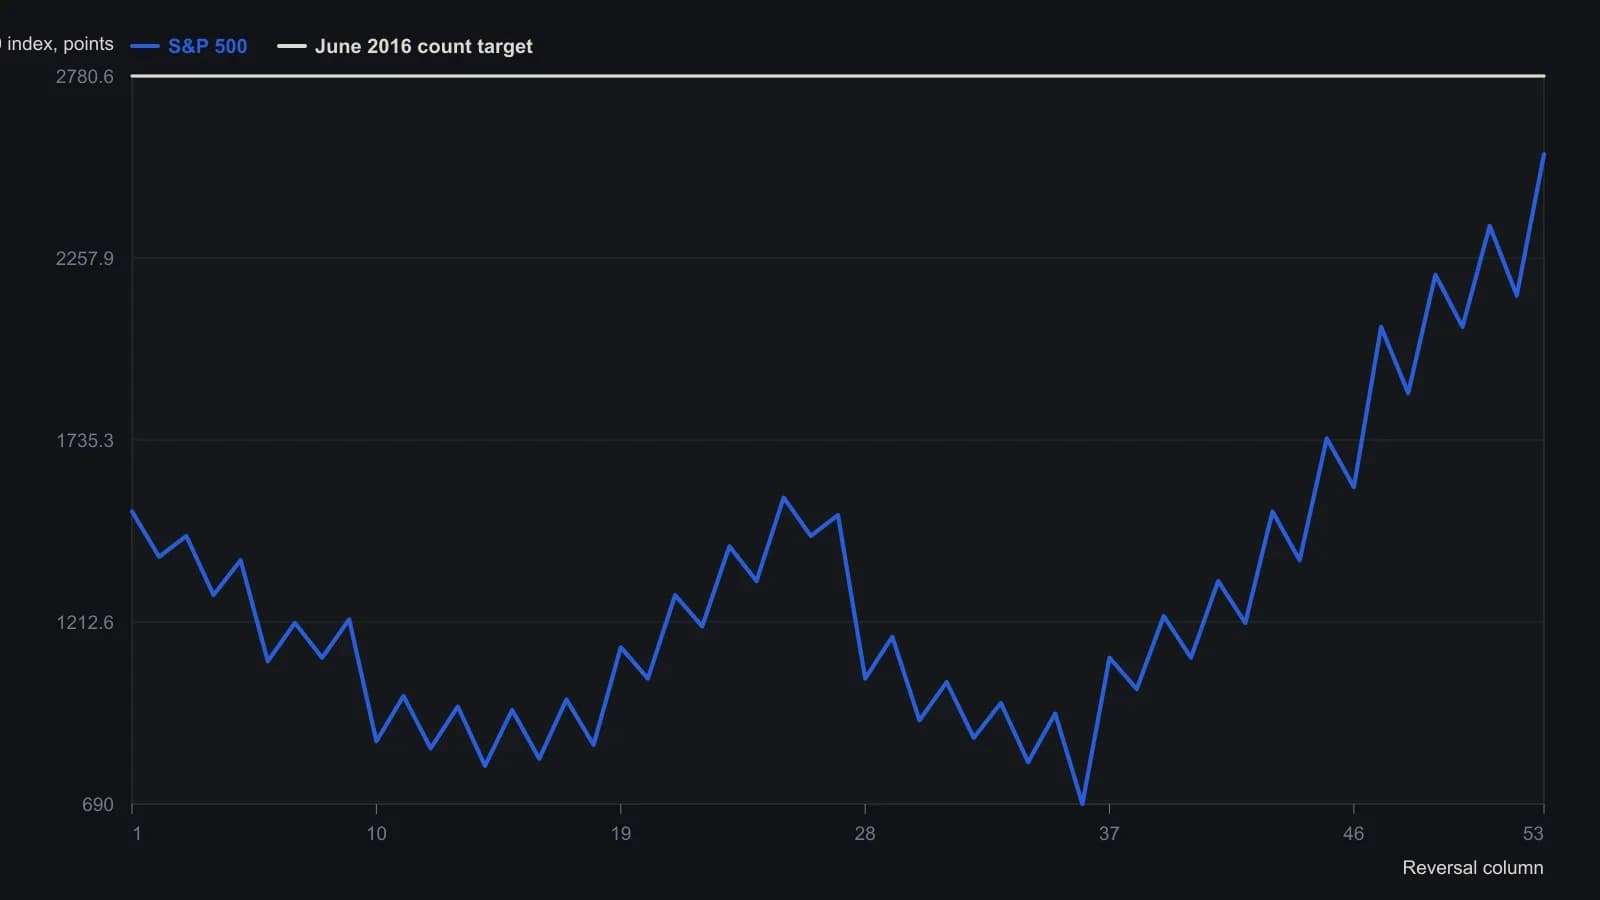
Updata daily close chart, 1% log box, three-box reversal, dated 17 Oct 2017. Unlabeled turns are raster reads from the log grid, rounded to the nearest ten index points, and skip some minor columns. The 2780.56 series is the printed count target, not a traded high.
All readings on this track · 30 readings
- 1988Constructing trend definitions with filters and lines
- 1989Reversal count as the clock on point-and-figure charts
- 1989Point-and-figure setup and session-average entry windows
- 1989Two-scale point-and-figure trendlines and stop placement
- 1989Adjusted net asset value, tighter reversals, and written stops on a fund point-and-figure chart
- 1990Stack option odds after point-and-figure signals
- 1991Constructing a point-and-figure downtrend-break
- 1991Constructing point-and-figure box and reversal charts
- 1991Constructing a close-tested one-two ladder on a point-and-figure chart
- 1992Point-and-figure, breadth, and volume as falsifiable hypotheses
- 1992Three-gate stock selection with ranks and point and figure
- 1993Constructing combined stochastics and point-and-figure relative strength
- 1997Point-and-figure box scale and reversal construction
- 2000Cotton weekly point-and-figure: late-stage decline, named weekly close
- 2000Constructing point-and-figure charts for support, resistance, and breakouts
- 2001Swiss franc: seasonal permission and a weekly point-and-figure breakout
- 2001Constructing point-and-figure boxes and reversals
- 2002Point-and-figure construction: box, live column, and three-box reversal
- 2003E-mini point-and-figure box-size and a descending-triangle breakout
- 2003A reconstruction critique of point-and-figure daytrading
- 2004Point-and-figure column moving-average crossovers
- 2005Box-series transforms for trend and channel work
- 2006Constructing bearish point-and-figure support breaks
- 2008Point-and-figure forex breakouts and triangles
- 2012From tactile charts to written trade rules
- 2013Combine a Point and figure chart and Moving-average crossover inside one System optimization procedure
- 2015Point-and-figure time and volume limits are conventions to test
- 2016Measurement-first critique of indicator defaults
- 2017Point-and-figure construction, reversals, and column-based overlays
- 2019A 2019 charting case as a three-check trend classroom