1997issue C031-6
Point-and-figure box scale and reversal construction
A point-and-figure chart is built with two construction knobs: box size, which fits the price range onto the sheet, and reversal width, which starts a new column only after a real change of direction. The finished grid is a test of whether a triangle or range has broken, not a clock for entries and not a complete trading system.
- A point-and-figure chart plots only price change as alternating X columns for up moves and O columns for down moves, with no time or volume axis.
- Only prices that reach the chosen box value are plotted, so the box is the vertical scale that compresses the raw range onto the sheet.
- A common default reversal is three boxes, but that default is not always the most readable setting for seeing a triangle breakout or later consolidation.
- Because the method removes time, the chart does not time entries by itself and is meant to confirm or reject breakout and trendline hypotheses drawn from other views.
Price change without a clock
A point-and-figure chart plots only price change. Alternating X columns record up moves and O columns record down moves. There is no time axis and no volume axis.
Construction stays in the same column until price changes direction. The plot then steps one column to the right and continues diagonally in the new direction.
The first plotted mark is chosen from prior direction. An X is used when the opening observation is already a higher price than the day before.
The box as a vertical scale
Only prices that reach the chosen box value are plotted. The box is the vertical scale that compresses the raw range onto the sheet.
In the worked example, 55 daily closes ranging from 53 to 74, a 21-point spread, were rounded to a 3-unit box so nine cells from 77 down to 51 could hold the series.
Petroz Resources closes at three box scales
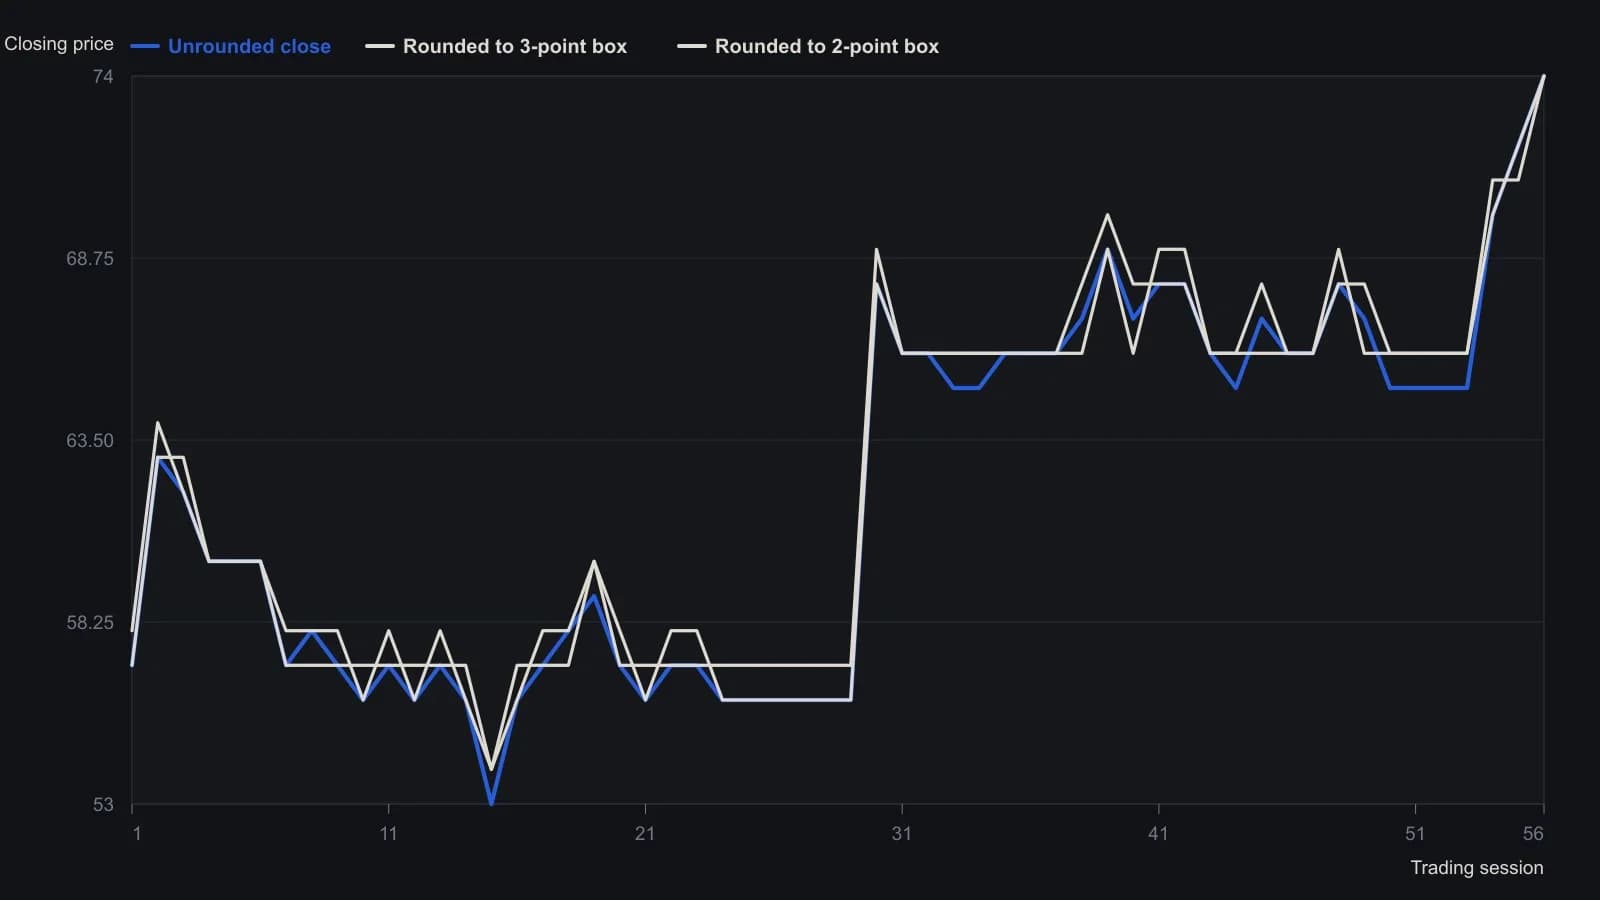
Guppy plots closing prices only. The prose calls the sample 55 sessions; the printed grid has 56 closes from 951114 through 960116.
Reversal width starts a new column
A common default reversal is three boxes. Price must reverse by at least three cells before a new column is started. That default is not always the most readable setting.
Reading a triangle or range breakout
A triangle on this chart is a contracting congestion of alternating columns. A breakout is a move that leaves a prior congestion, trading range, or triangle by enough boxes to start a new directional column.
Changing box size and reversal width can make a triangle breakout and later consolidation visible that is harder to isolate on a bar chart.
Scale and reversal are judged correct when the chart's structure matches what counts as a real breakout for that series, not when a software default is left untouched.
Because the method removes time, a point-and-figure chart does not time entries by itself. It is meant to confirm or reject breakout and trendline hypotheses drawn from other views.
All readings on this track · 30 readings
- 1988Constructing trend definitions with filters and lines
- 1989Reversal count as the clock on point-and-figure charts
- 1989Point-and-figure setup and session-average entry windows
- 1989Two-scale point-and-figure trendlines and stop placement
- 1989Adjusted net asset value, tighter reversals, and written stops on a fund point-and-figure chart
- 1990Stack option odds after point-and-figure signals
- 1991Constructing a point-and-figure downtrend-break
- 1991Constructing point-and-figure box and reversal charts
- 1991Constructing a close-tested one-two ladder on a point-and-figure chart
- 1992Point-and-figure, breadth, and volume as falsifiable hypotheses
- 1992Three-gate stock selection with ranks and point and figure
- 1993Constructing combined stochastics and point-and-figure relative strength
- 1997Point-and-figure box scale and reversal construction
- 2000Cotton weekly point-and-figure: late-stage decline, named weekly close
- 2000Constructing point-and-figure charts for support, resistance, and breakouts
- 2001Swiss franc: seasonal permission and a weekly point-and-figure breakout
- 2001Constructing point-and-figure boxes and reversals
- 2002Point-and-figure construction: box, live column, and three-box reversal
- 2003E-mini point-and-figure box-size and a descending-triangle breakout
- 2003A reconstruction critique of point-and-figure daytrading
- 2004Point-and-figure column moving-average crossovers
- 2005Box-series transforms for trend and channel work
- 2006Constructing bearish point-and-figure support breaks
- 2008Point-and-figure forex breakouts and triangles
- 2012From tactile charts to written trade rules
- 2013Combine a Point and figure chart and Moving-average crossover inside one System optimization procedure
- 2015Point-and-figure time and volume limits are conventions to test
- 2016Measurement-first critique of indicator defaults
- 2017Point-and-figure construction, reversals, and column-based overlays
- 2019A 2019 charting case as a three-check trend classroom