1993issue C021-5
Constructing combined stochastics and point-and-figure relative strength
Average three stochastic lookback pairs into one heavily smoothed combined stochastic, then encode a stock-versus-index comparison as a one-time scaled composite that a point-and-figure grid can reread.
- A combined stochastic is assembled by averaging three stochastic lookback pairs, 30 and 15, 60 and 30, and 90 and 45, presented as a 30-day, 60-day, and 90-day blend with heavy smoothing so the underlying trend is easier to see.
- Other lookback combinations are invited on the same construction pattern when the aim is to mark important tops or bottoms.
- Point-and-figure relative strength starts from a relative-strength composite: the stock scaled by 1000, the index left at 1.00, and division so the values are whole numbers.
- That composite is a one-time setup per comparison and can later be reopened as a point-and-figure chart. Illustrated charts use a box size of 1 or 0.5 and a reversal amount of 3.
Assembling the combined stochastic
A combined stochastic can be assembled by averaging three stochastic calculations whose lookback pairs are 30 and 15, 60 and 30, and 90 and 45. Those three lengths are presented as a 30-day, 60-day, and 90-day stochastic blend, with heavy smoothing chosen so the underlying trend is easier to see.
Other lookback combinations are invited as a way to mark important tops or bottoms on the same construction pattern.
Combined 30/60/90 stochastic on the S&P 500, 1986–1990
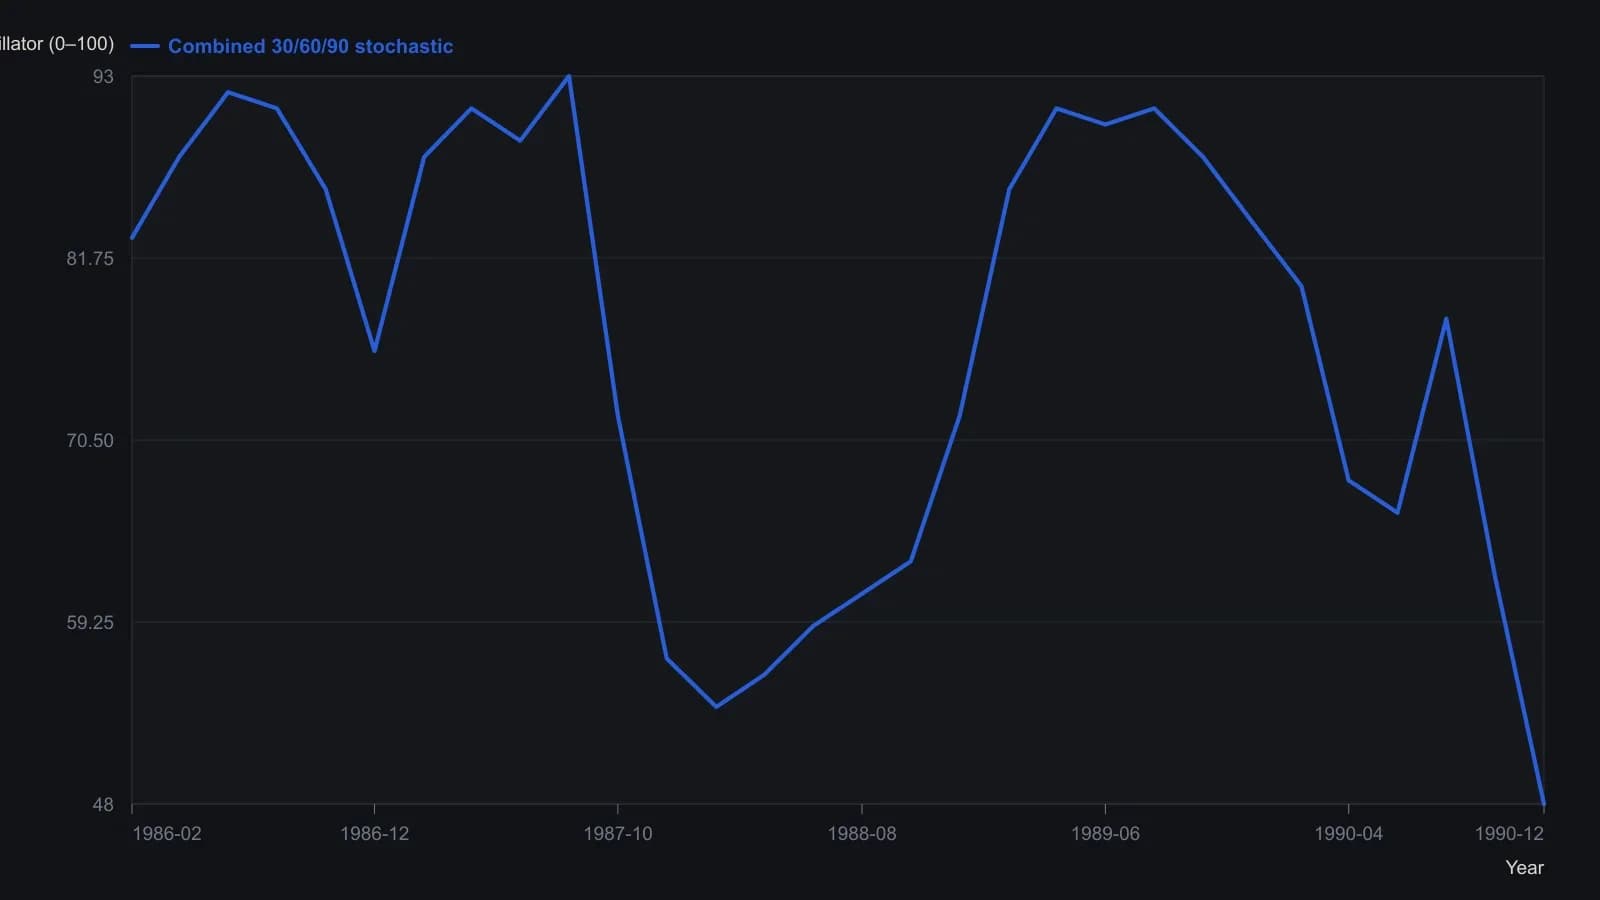
Formula in the tip is (stoch(30,15)+stoch(60,30)+stoch(90,45))/3. The oscillator only appears once the long lookback is filled, so the trace begins near 1986 even though the price pane starts in 1983. Values are approximate visual readings from the 45–95 scale.
Pairing the blend with an index figure
A figure of a broad equity index is paired with that combined stochastic series. The pairing is captioned as marking extreme overbought and oversold readings plus the market's general trend.
Encoding relative strength for a point-and-figure grid
Point-and-figure relative strength is constructed by defining a relative-strength composite of a chosen stock and a chosen index, then applying a point-and-figure display to that composite.
In the illustrated composites the stock side is scaled by a factor of 1000, the index side remains at 1.00, and the operator is division so the relative-strength values are whole numbers.
The composite is described as a one-time setup per comparison that can later be reopened as a point-and-figure chart or as a saved layout.
One illustrated relative-strength chart uses a box size of 1 and a reversal amount of 3. Another uses a box size of 0.5 and a reversal amount of 3.
What the illustrated columns show
One illustrated relative-strength chart is described as remaining positive into August 1990 and then turning down into October 1990. A second illustrated relative-strength chart is described as remaining in a downtrend into October 1990.
All readings on this track · 30 readings
- 1988Constructing trend definitions with filters and lines
- 1989Reversal count as the clock on point-and-figure charts
- 1989Point-and-figure setup and session-average entry windows
- 1989Two-scale point-and-figure trendlines and stop placement
- 1989Adjusted net asset value, tighter reversals, and written stops on a fund point-and-figure chart
- 1990Stack option odds after point-and-figure signals
- 1991Constructing a point-and-figure downtrend-break
- 1991Constructing point-and-figure box and reversal charts
- 1991Constructing a close-tested one-two ladder on a point-and-figure chart
- 1992Point-and-figure, breadth, and volume as falsifiable hypotheses
- 1992Three-gate stock selection with ranks and point and figure
- 1993Constructing combined stochastics and point-and-figure relative strength
- 1997Point-and-figure box scale and reversal construction
- 2000Cotton weekly point-and-figure: late-stage decline, named weekly close
- 2000Constructing point-and-figure charts for support, resistance, and breakouts
- 2001Swiss franc: seasonal permission and a weekly point-and-figure breakout
- 2001Constructing point-and-figure boxes and reversals
- 2002Point-and-figure construction: box, live column, and three-box reversal
- 2003E-mini point-and-figure box-size and a descending-triangle breakout
- 2003A reconstruction critique of point-and-figure daytrading
- 2004Point-and-figure column moving-average crossovers
- 2005Box-series transforms for trend and channel work
- 2006Constructing bearish point-and-figure support breaks
- 2008Point-and-figure forex breakouts and triangles
- 2012From tactile charts to written trade rules
- 2013Combine a Point and figure chart and Moving-average crossover inside one System optimization procedure
- 2015Point-and-figure time and volume limits are conventions to test
- 2016Measurement-first critique of indicator defaults
- 2017Point-and-figure construction, reversals, and column-based overlays
- 2019A 2019 charting case as a three-check trend classroom