2005issue C011-5
Box-series transforms for trend and channel work
Walking a point-and-figure plot in print order yields a box-series that can be redrawn as a line chart interchangeable with the original grid. A confirmation-average and a box-series-macd can then sit on the same reconstructed axis, including change-only and time-extended forms.
- Walking a point-and-figure plot in print order produces a box-series that can be redrawn as a line chart interchangeable with the original grid.
- The box-series is a price study that applies adaptive nonlinear smoothing and adaptive compression of unequal time spans in one step.
- A confirmation-average of a sequentially indexed box-series, and a box-series-macd on a change-only-box-series, can be read against the reconstructed boxes on the same axis.
- A time-extended-box-series keeps the bar clock, recovers ordinary top and bottom signals, and lets close-only versus high/low inputs and two-box versus three-box reversal counts be compared on the same bars.
From printed boxes to a line series
Walking a point-and-figure plot in print order and recording each box value yields a numeric series. That box-series can be redrawn as a line chart interchangeable with the original grid.
The box-series is a price study that applies adaptive nonlinear smoothing and adaptive compression of unequal time spans in one step. Box-height is the vertical price increment that defines one box. Reversal-count is how many boxes price must travel against the active column before a new column is opened.
S&P 500 box-series on a sequential index
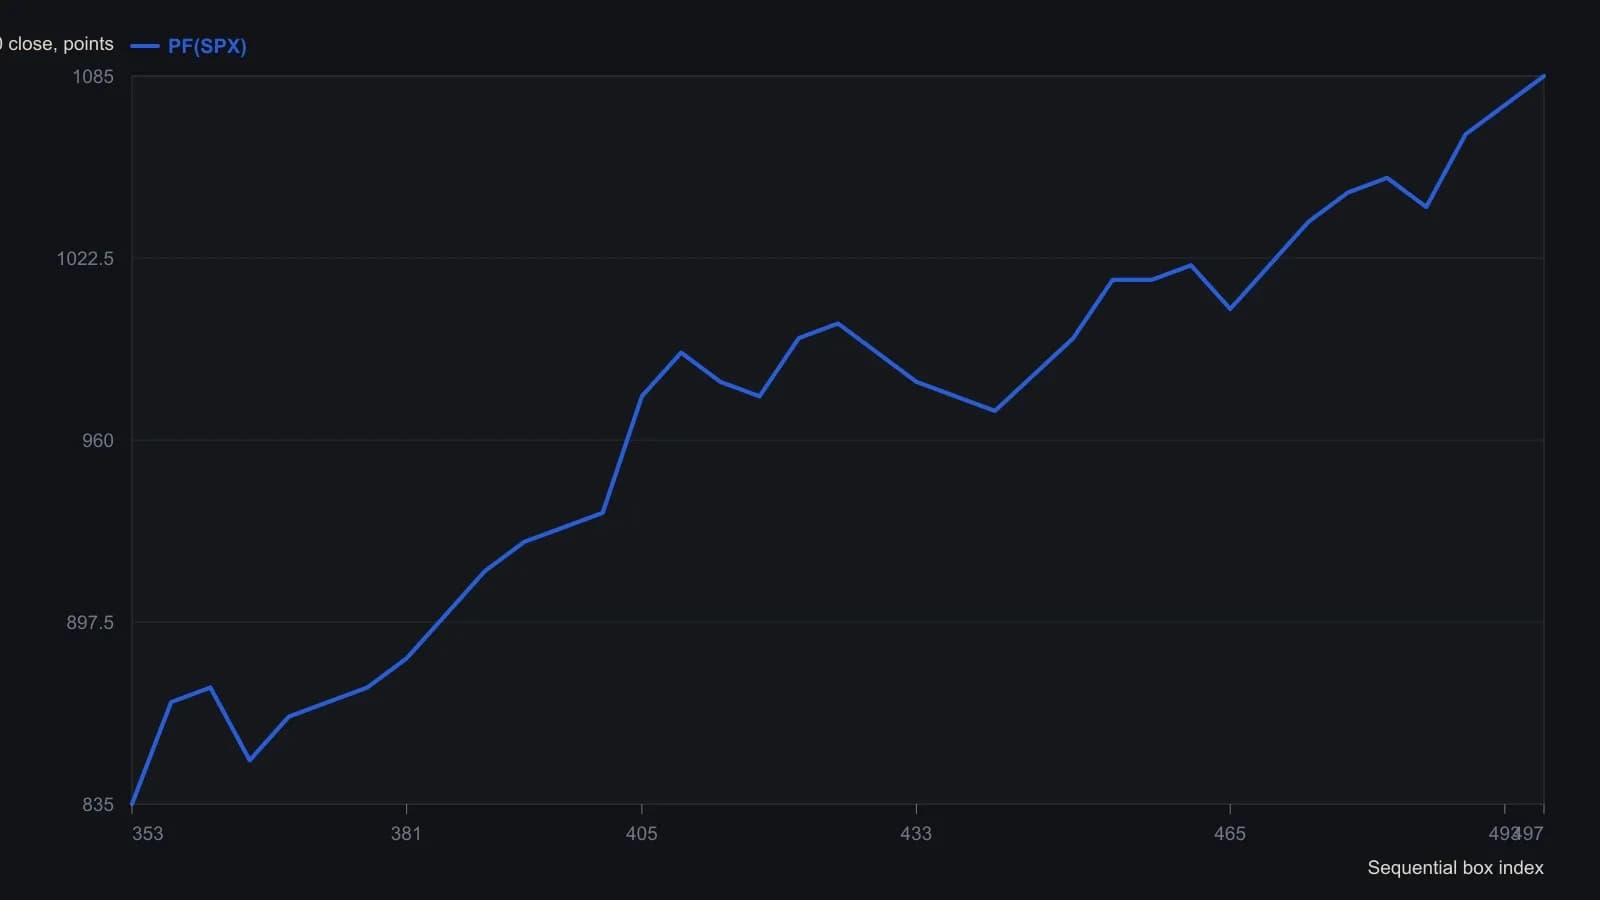
The source built PF(SPX) with a 10-point box and a three-box reversal. Y-values are visual reads to the nearest five points; the first x-label is cropped by the FDC mark and is taken as 353.
A confirmation-average on the box-series
A 15-period moving average of a sequentially indexed box-series can be plotted as a confirmation overlay. It tends to sit above the series on down moves and below it on up moves, with heavy overlap as a warning that a move may be losing force.
The confirmation-average is a moving average of a box-series used to judge whether a move still stands away from its own smoothed path.
A change-only-box-series and box-series-macd
A change-only-box-series records the current box on each date the box changes and skips filled intermediate boxes, so each point has a calendar date and keeps how quickly price crossed boxes.
MACD applied to the change-only-box-series can diverge from that series, which can be inspected as a condition that the active move may be changing. A box-series-macd is a MACD computed on a box series so oscillator swings can be compared with the reconstructed boxes themselves.
A time-extended-box-series and recoverable signals
Time-extended construction steps one square right on every bar and records only the current box, repeating unchanged values. The time-extended-box-series is a same-period smoother from which ordinary tops, bottoms, and double- or triple-top signals remain recoverable.
Parallel inputs and a recovered display
Close-only versus high/low inputs, and two-box versus three-box reversal counts, can be plotted as parallel time-extended series so earlier reversals versus extra false turns can be compared on the same bars.
Expanding one-box-reversal box data into four-column rows and plotting those rows as candlesticks recovers a renko display for a chosen box-height.
All readings on this track · 30 readings
- 1988Constructing trend definitions with filters and lines
- 1989Reversal count as the clock on point-and-figure charts
- 1989Point-and-figure setup and session-average entry windows
- 1989Two-scale point-and-figure trendlines and stop placement
- 1989Adjusted net asset value, tighter reversals, and written stops on a fund point-and-figure chart
- 1990Stack option odds after point-and-figure signals
- 1991Constructing a point-and-figure downtrend-break
- 1991Constructing point-and-figure box and reversal charts
- 1991Constructing a close-tested one-two ladder on a point-and-figure chart
- 1992Point-and-figure, breadth, and volume as falsifiable hypotheses
- 1992Three-gate stock selection with ranks and point and figure
- 1993Constructing combined stochastics and point-and-figure relative strength
- 1997Point-and-figure box scale and reversal construction
- 2000Cotton weekly point-and-figure: late-stage decline, named weekly close
- 2000Constructing point-and-figure charts for support, resistance, and breakouts
- 2001Swiss franc: seasonal permission and a weekly point-and-figure breakout
- 2001Constructing point-and-figure boxes and reversals
- 2002Point-and-figure construction: box, live column, and three-box reversal
- 2003E-mini point-and-figure box-size and a descending-triangle breakout
- 2003A reconstruction critique of point-and-figure daytrading
- 2004Point-and-figure column moving-average crossovers
- 2005Box-series transforms for trend and channel work
- 2006Constructing bearish point-and-figure support breaks
- 2008Point-and-figure forex breakouts and triangles
- 2012From tactile charts to written trade rules
- 2013Combine a Point and figure chart and Moving-average crossover inside one System optimization procedure
- 2015Point-and-figure time and volume limits are conventions to test
- 2016Measurement-first critique of indicator defaults
- 2017Point-and-figure construction, reversals, and column-based overlays
- 2019A 2019 charting case as a three-check trend classroom