1992issue C061-8
Three-gate stock selection with ranks and point and figure
This archive workflow selects names through three sequenced gates rather than one blended score. An earnings checklist decides eligibility and later exit, rank-rotation orders only the survivors, and logarithmic point-and-figure can still veto a purchase if the path is not zigzagging upward.
- The earnings-consistency-screen is binary: a down year in the last five annual earnings prints, or a quarter in the last two years below the same quarter a year earlier, deletes the name.
- Rank-rotation scores only the listed-market shortlist of 30 to 50 names, totaling six fundamental plus-minus-marks and seven technical plus-minus-marks into fundamental, technical, and combined ranks.
- Point-and-figure remains a veto: purchase is reserved for a logarithmic path that is zigzagging upward, with higher highs and higher lows, and without an excessive price-to-earnings reading.
- Editorial reading: combination is testable only when screening, relative priority, and chart confirmation can each force abstention.
A sequenced checklist, not one score
This archive workflow treats stock selection as a checklist-process. A name can be refused at the earnings screen, at the listed-market and shortlist stage, at the combined rank, at the chart gate, or after a later quarterly earnings break.
The sequence is fixed. Names that fail the earnings test never reach the ranks. Names that never enter the shortlist are not compared. Purchase is still withheld unless logarithmic point-and-figure shows a path that is zigzagging upward without an excessive price-to-earnings reading.
Eligibility and the later exit
The first gate is an earnings-consistency-screen. A name is deleted if any of the prior five years shows a decline in earnings per share, or if any quarter in the last two years prints below the same quarter of the preceding year.
Surviving names are further restricted to a major listed exchange. After that cut, hundreds of qualifying names are reduced to a study set of 30 to 50.
The same earnings test stays in force after a purchase. If a later quarter reports earnings per share below the same quarter of the preceding year, the name is sold.
Ranks only among the survivors
Only the shortlist is scored. Rank-rotation assigns a plus-minus-mark, from double plus to double minus, inside each of six fundamental angles and seven technical angles. Those marks are totaled into a fundamental rank, a technical rank, and a combined rank so that only relatively stronger names stay in the working set.
Fundamental marks favor lower price-to-earnings, larger capitalization, a steeper least-squares slope fitted to the logarithms of earnings per share, a positive latest-earnings deviation from that fitted line, a cash-only dividend record, and a lower pe-growth-ratio.
The pe-growth-ratio is price-to-earnings divided by the fitted earnings-growth rate. It is split into quartiles. The highest 25 percent of ratios are marked worst. The lowest 25 percent are marked best.
Technical marks include current price versus five- and 19-week exponential-average equivalents, swing classification after a 10 percent filter, an insider score, the ratio of volume on the last five rising days to volume on the last five declining days, relative strength versus a broad index, the count of institutional holders, and the three-month change in the institutional share of holdings.
Combined, fundamental and technical ranks for three NYSE growth names
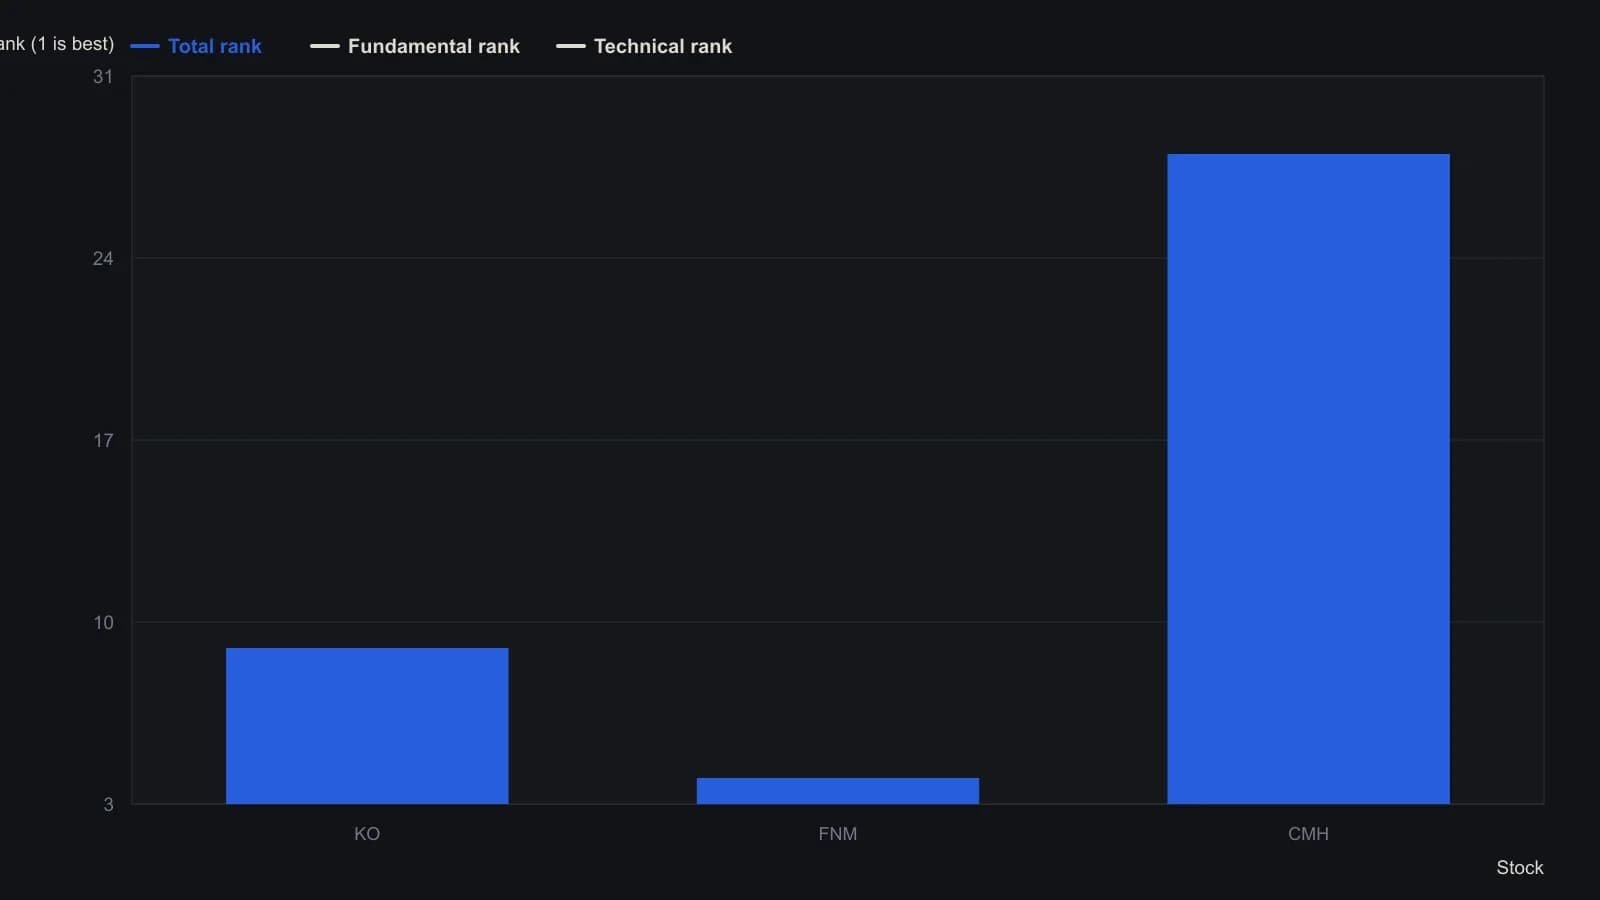
Merrill first totals the plus-minus factor scores, then ranks those totals, so tied scores cause some rank numbers to be skipped.
The chart can still refuse the purchase
A favorable combined rank does not complete the purchase decision. Logarithmic point-and-figure is the last purchase gate. It accepts only a path that is zigzagging upward, with higher highs and higher lows, and whose price-to-earnings does not appear excessive.
Comparison charts keep a filtered-swing only after moves smaller than 10 percent have been discarded. A logarithmic vertical scale lets names be read on a common basis.
Dashed overlay lines equal to earnings per share multiplied by 10, 15, or 20 are used to judge how expensive price is relative to those multiples and to compare growth by the slope of the lines.
All readings on this track · 30 readings
- 1988Constructing trend definitions with filters and lines
- 1989Reversal count as the clock on point-and-figure charts
- 1989Point-and-figure setup and session-average entry windows
- 1989Two-scale point-and-figure trendlines and stop placement
- 1989Adjusted net asset value, tighter reversals, and written stops on a fund point-and-figure chart
- 1990Stack option odds after point-and-figure signals
- 1991Constructing a point-and-figure downtrend-break
- 1991Constructing point-and-figure box and reversal charts
- 1991Constructing a close-tested one-two ladder on a point-and-figure chart
- 1992Point-and-figure, breadth, and volume as falsifiable hypotheses
- 1992Three-gate stock selection with ranks and point and figure
- 1993Constructing combined stochastics and point-and-figure relative strength
- 1997Point-and-figure box scale and reversal construction
- 2000Cotton weekly point-and-figure: late-stage decline, named weekly close
- 2000Constructing point-and-figure charts for support, resistance, and breakouts
- 2001Swiss franc: seasonal permission and a weekly point-and-figure breakout
- 2001Constructing point-and-figure boxes and reversals
- 2002Point-and-figure construction: box, live column, and three-box reversal
- 2003E-mini point-and-figure box-size and a descending-triangle breakout
- 2003A reconstruction critique of point-and-figure daytrading
- 2004Point-and-figure column moving-average crossovers
- 2005Box-series transforms for trend and channel work
- 2006Constructing bearish point-and-figure support breaks
- 2008Point-and-figure forex breakouts and triangles
- 2012From tactile charts to written trade rules
- 2013Combine a Point and figure chart and Moving-average crossover inside one System optimization procedure
- 2015Point-and-figure time and volume limits are conventions to test
- 2016Measurement-first critique of indicator defaults
- 2017Point-and-figure construction, reversals, and column-based overlays
- 2019A 2019 charting case as a three-check trend classroom