2000issue C121-5
Constructing point-and-figure charts for support, resistance, and breakouts
Point-and-figure construction records price change only. Box size and a three-box reversal decide which moves are large enough to start a new column. In the TradersWeek editorial reading, the finished X and O columns become a map of support, resistance, and breakout tests that can be confirmed or invalidated on that same scale.
- Point-and-figure construction records price change only, and calendar time on the horizontal axis is only a reference frame.
- A three-box reversal starts a new opposite column only after price moves three times the box size against the current column, so a two-dollar box requires a six-dollar adverse move.
- Resistance is read where several X columns terminate at one price, and support is read where several O columns terminate at one price.
- An X column that exceeds the prior X column is read as a breakout above previously tested resistance, while a triple-top, spread triple-top, bullish catapult, and bullish signal reversal are later constructions on that same column map.
Set box size and the three-box reversal first
Point-and-figure construction records price change only. Calendar time may be labeled on the horizontal axis solely as a reference frame. Each X marks one box-size advance and each O one box-size decline, stacked in vertical columns that change direction only when the reversal rule is met.
Box size is the fixed price increment represented by a single X or a single O. A three-box reversal starts a new opposite column only after price moves three times the box size against the current column. A two-dollar box therefore requires a six-dollar adverse move.
Box size is commonly scaled to price level, with half-dollar boxes often used between five and twenty dollars and one-dollar boxes between twenty and one hundred. Larger boxes can be chosen so reversal zones mark more substantial support and resistance.
TradersWeek editorial reading: choose the box size and the three-box reversal first, so that only material price change is allowed to exist. The resulting X and O columns are then read as a map of support, resistance, and breakout tests that can be confirmed or invalidated on the same scale.
Read the columns as support, resistance, and breakout tests
Support and resistance are price levels inferred from repeated column endings: several X-column highs for resistance and several O-column lows for support. Resistance is read where several X columns terminate at one price. Support is read where several O columns terminate at one price.
A breakout is a later column that exceeds a previously established column extreme, treated as a testable violation of that support or resistance level. An X column that exceeds the prior X column is read as a breakout above previously tested resistance. That upside condition is not recorded at or near lows and remains in force until an O column falls below a prior O column.
Keep later constructions on the same scale
A triple-top upside construction requires at least two earlier X-column highs at one level, a later X column that clears that high, and a minimum of five vertical columns.
A spread triple-top upside construction is completed when price exceeds three prior tops that need not occupy consecutive columns during a consolidation.
A bullish catapult is built only after a triple-top breakout. Sellers appear, the pullback stays above the prior O-column low, and a later X column again exceeds the previous X column.
A bullish signal reversal after at least five columns of lower highs and lower lows is completed when an X column finally exceeds the prior X column. The whole formation spans at least seven columns.
TradersWeek editorial reading: these named constructions are later readings of the same X and O map. A breakout can still be confirmed or invalidated on the scale set by the box size and the three-box reversal.
Emerson Electric P&F column ends versus $65 resistance
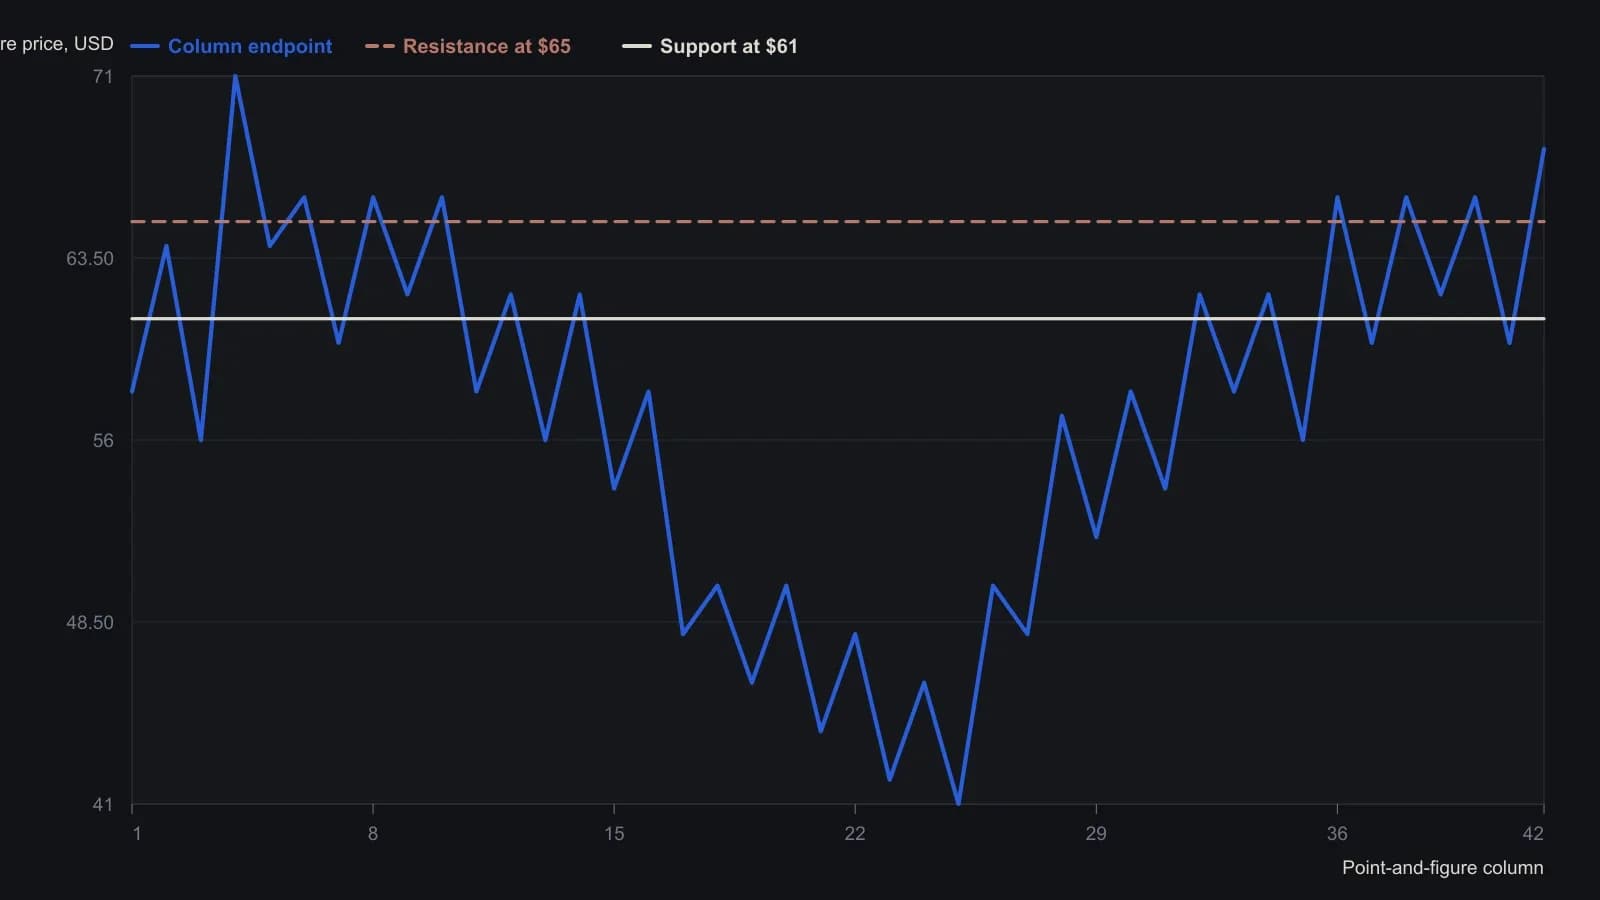
Endpoints are to the nearest $1 box on the raster. The source chart is a three-box reversal; month letters on the horizontal axis are reference marks only. AIQ TradingExpert constructed the figure.
All readings on this track · 30 readings
- 1988Constructing trend definitions with filters and lines
- 1989Reversal count as the clock on point-and-figure charts
- 1989Point-and-figure setup and session-average entry windows
- 1989Two-scale point-and-figure trendlines and stop placement
- 1989Adjusted net asset value, tighter reversals, and written stops on a fund point-and-figure chart
- 1990Stack option odds after point-and-figure signals
- 1991Constructing a point-and-figure downtrend-break
- 1991Constructing point-and-figure box and reversal charts
- 1991Constructing a close-tested one-two ladder on a point-and-figure chart
- 1992Point-and-figure, breadth, and volume as falsifiable hypotheses
- 1992Three-gate stock selection with ranks and point and figure
- 1993Constructing combined stochastics and point-and-figure relative strength
- 1997Point-and-figure box scale and reversal construction
- 2000Cotton weekly point-and-figure: late-stage decline, named weekly close
- 2000Constructing point-and-figure charts for support, resistance, and breakouts
- 2001Swiss franc: seasonal permission and a weekly point-and-figure breakout
- 2001Constructing point-and-figure boxes and reversals
- 2002Point-and-figure construction: box, live column, and three-box reversal
- 2003E-mini point-and-figure box-size and a descending-triangle breakout
- 2003A reconstruction critique of point-and-figure daytrading
- 2004Point-and-figure column moving-average crossovers
- 2005Box-series transforms for trend and channel work
- 2006Constructing bearish point-and-figure support breaks
- 2008Point-and-figure forex breakouts and triangles
- 2012From tactile charts to written trade rules
- 2013Combine a Point and figure chart and Moving-average crossover inside one System optimization procedure
- 2015Point-and-figure time and volume limits are conventions to test
- 2016Measurement-first critique of indicator defaults
- 2017Point-and-figure construction, reversals, and column-based overlays
- 2019A 2019 charting case as a three-check trend classroom