2019issue C0138-42
A 2019 charting case as a three-check trend classroom
A 2019 charting-desk case study placed point-and-figure columns, nearby support-resistance, and a relative-strength reading from a stated lookback in one workspace. Editorial reading treats that stack as a three-check trend test: the column names the condition, a level says whether the path still has something to respect, and the lookback reading confirms or vetoes.
- A 2019 workspace listed point-and-figure views with candlestick, bar, line, and multi-horizon-gallery charts so one ticker could be inspected from intraday through yearly scale.
- A technical-rank that blended moving averages, rate of change, and a relative-strength measure ordered names from high to low. The top tenth sat near 90 to 100 on a scale that ran from near 100 down to zero, and a high score was treated as a confirmation check rather than a standalone call.
- A scan table of 80 named conditions, including 19 bullish and bearish point-and-figure patterns, could turn a repeatable column event into a candidate count by exchange. Hits still had to be reopened, because one listed condition was current while another referred to an earlier, inactive setup.
- Editorial reading: treat the stack as three locks. A column-break names the condition, support-resistance asks whether a level remains to respect, and a lookback-threshold on relative-strength-index confirms or vetoes the idea.
What the 2019 case recorded
A 2019 case study of a charting workspace listed point-and-figure views together with candlestick, bar, line, and multi-horizon-gallery charts. The same ticker could be inspected from intraday through yearly scale.
Point-and-figure records price reversals of a chosen box size rather than every clock interval, so a column-break can be stated as a dated, testable condition.
A rank that still needs the opened chart
The same workspace computed a technical-rank from several indicators, including moving averages, rate of change, and a relative-strength measure, across short, medium, and long lookbacks, then ordered names from high to low.
That rank placed the top tenth of names near 90 to 100 on a scale that ran from near 100 down to zero. A high score could be treated as a quantitative confirmation check rather than a standalone call.
The write-up states that a high rank plus a new high is incomplete until support, resistance, and percent distance from moving averages are read on the opened chart.
From a scan-condition to a candidate list
A predefined scan table is described as covering 80 named conditions, including 19 bullish and bearish point-and-figure patterns. A repeatable column event could be turned into a candidate count by exchange.
A custom scan recipe in the same case study combines a new 52-week high with a relative-strength reading above 70. That pairing shows how a lookback-threshold can sit beside a chart event so the quantitative check can be reproduced.
The write-up warns that a named point-and-figure scan-condition should be reopened on the actual chart. One listed condition was current, while another referred to an earlier, no-longer-active setup.
Bullish predefined-scan hits, 31 August 2018
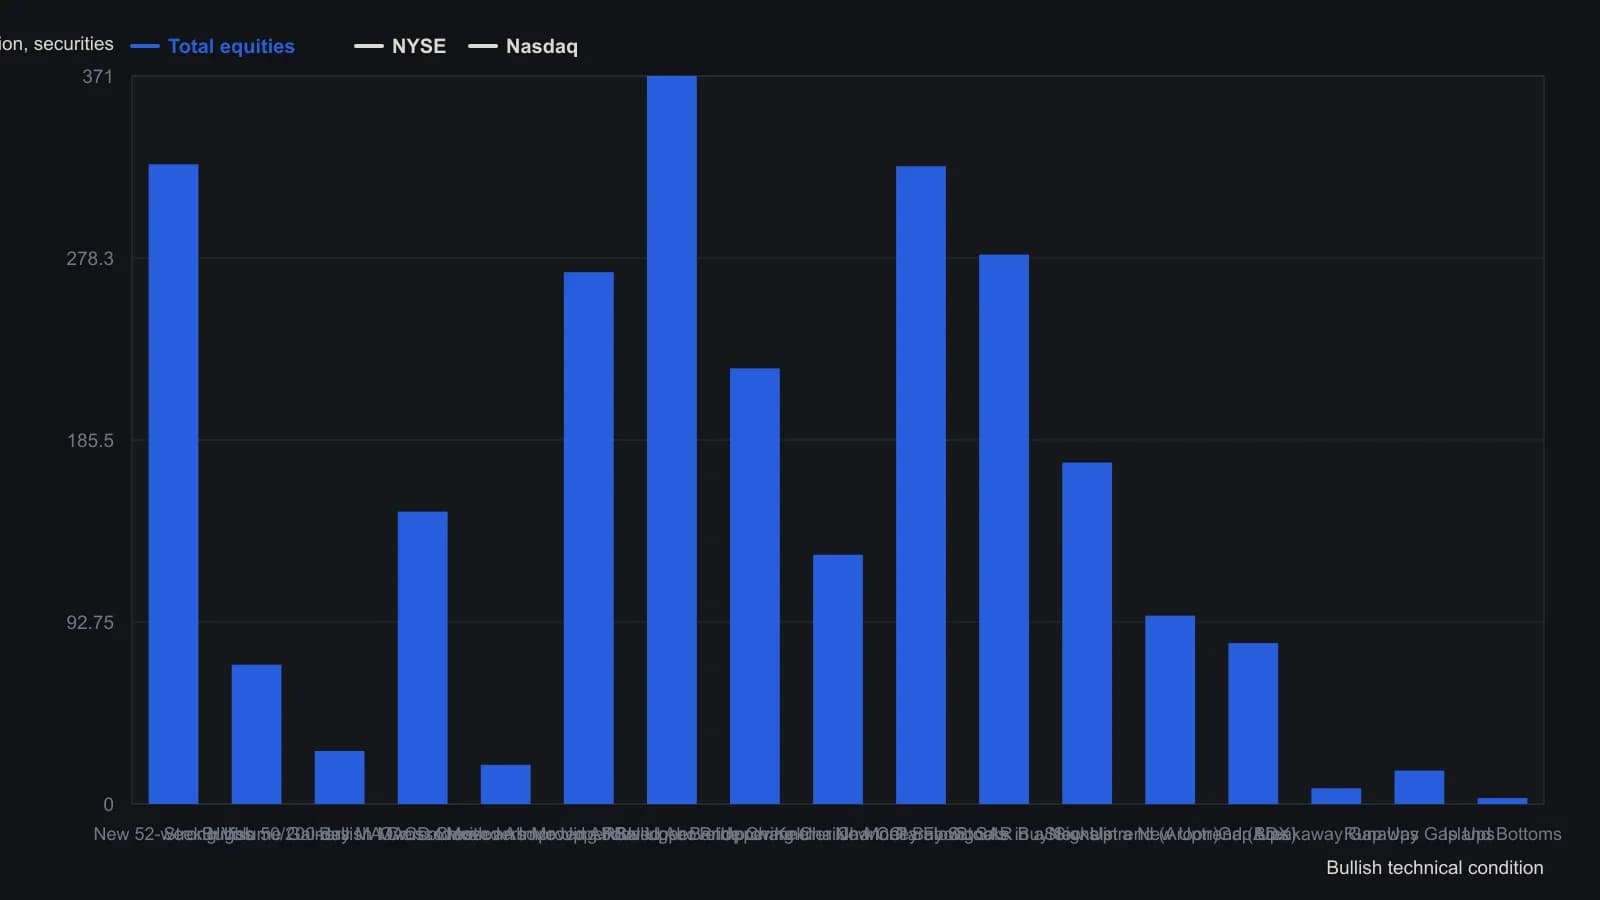
The site's predefined scans cannot be rewritten, and only the bullish-indicator block is in this screenshot; bearish rows begin immediately below. The Total cell is the site's own equity total and does not always equal the sum of the exchange columns. Mutual-fund counts are a separate tabulation and are omitted.
A dated column-break and session scales
A daily point-and-figure example marks two sell events after an August peak print and later treats a prior spring low as a candidate support zone. The sequence illustrates a dated column-break hypothesis rather than a finished verdict.
Intraday point-and-figure scales of one and five minutes are described as a way to read session support-resistance together with a relative-strength oscillator when testing whether the daily column-break still holds.
Editorial reading of the three checks
Editorial reading, not archive language: the first lock is the column-break that names a buy or sell hypothesis at a stated print. The second lock is support-resistance, meaning prior swing, channel, or average-distance zones that repeatedly attract or reject trade, used here as the check after the column event. The third lock is relative-strength-index, a quantitative strength reading computed from ordered price observations over a defined lookback, which must agree with the chart hypothesis or the idea is set aside.
The multi-horizon-gallery keeps those three checks honest across scale. An intraday level can be compared with daily or longer structure before the candidate is kept.
All readings on this track · 30 readings
- 1988Constructing trend definitions with filters and lines
- 1989Reversal count as the clock on point-and-figure charts
- 1989Point-and-figure setup and session-average entry windows
- 1989Two-scale point-and-figure trendlines and stop placement
- 1989Adjusted net asset value, tighter reversals, and written stops on a fund point-and-figure chart
- 1990Stack option odds after point-and-figure signals
- 1991Constructing a point-and-figure downtrend-break
- 1991Constructing point-and-figure box and reversal charts
- 1991Constructing a close-tested one-two ladder on a point-and-figure chart
- 1992Point-and-figure, breadth, and volume as falsifiable hypotheses
- 1992Three-gate stock selection with ranks and point and figure
- 1993Constructing combined stochastics and point-and-figure relative strength
- 1997Point-and-figure box scale and reversal construction
- 2000Cotton weekly point-and-figure: late-stage decline, named weekly close
- 2000Constructing point-and-figure charts for support, resistance, and breakouts
- 2001Swiss franc: seasonal permission and a weekly point-and-figure breakout
- 2001Constructing point-and-figure boxes and reversals
- 2002Point-and-figure construction: box, live column, and three-box reversal
- 2003E-mini point-and-figure box-size and a descending-triangle breakout
- 2003A reconstruction critique of point-and-figure daytrading
- 2004Point-and-figure column moving-average crossovers
- 2005Box-series transforms for trend and channel work
- 2006Constructing bearish point-and-figure support breaks
- 2008Point-and-figure forex breakouts and triangles
- 2012From tactile charts to written trade rules
- 2013Combine a Point and figure chart and Moving-average crossover inside one System optimization procedure
- 2015Point-and-figure time and volume limits are conventions to test
- 2016Measurement-first critique of indicator defaults
- 2017Point-and-figure construction, reversals, and column-based overlays
- 2019A 2019 charting case as a three-check trend classroom