2004issue C131-3
Point-and-figure column moving-average crossovers
A time-period simple moving average does not correspond to a point-and-figure column sequence. This archive article rebuilds the average on column midpoints so classic X-and-O breakouts can be compared with a dual-average overlay on the same non-calendar chart.
- Point-and-figure columns have no linear calendar axis, so a conventional time-period simple moving average does not correspond to the sequence of X and O columns.
- The overlay treats each column midpoint as the input observation and averages those midpoints over a chosen number of columns.
- An upward cross of the five-column average through the ten-column average was treated as a buy condition, and a downward cross as a sell condition.
- The write-up treated entry and exit point differences as modest and identified staying through later pattern exits as the larger intended change.
A moving average without a calendar axis
Point-and-figure plots rising X columns and falling O columns from a chosen box size and reversal rule, without a linear calendar axis. Because those columns have no linear calendar axis, a conventional time-period simple moving average does not correspond to the sequence of X and O columns.
This article rebuilds a simple moving average on that column sequence so classic breakouts can be read next to a dual-average overlay on the same non-calendar chart.
How the column overlay is built
The overlay treats each column midpoint as the input observation. That midpoint is the column high plus the column low, divided by two. Those midpoints are then averaged over a chosen number of columns.
A simple moving average in this setting is the mean of a fixed number of successive observations. The observations are successive column midpoints rather than calendar bars.
The illustrated construction used five-column and ten-column simple averages after changing a three-box reversal chart to a one-box reversal so more columns were available for the overlay. A one-box reversal starts a new column after a one-box contrary move, producing more columns than a three-box reversal.
Classic patterns and the crossover rule
Classic point-and-figure practice lists eight common buy patterns and eight common sell patterns. After one of those patterns prints, the chart itself does not state how long the new move will last.
A double-top breakout is a buy pattern in which a later X column exceeds a prior X-column high. A double-bottom breakout is a sell pattern in which a later O column exceeds a prior O-column low. A triple-spread-top is a three-peak buy pattern in which an intervening X column fails to reach the same high as the other two.
An upward cross of the five-column average through the ten-column average was treated as a buy condition, and a downward cross as a sell condition.
What the illustrated charts showed
On one illustrated chart a buy crossover printed at 10 versus a later double-top breakout at 15. A sell crossover printed at 20 versus a double-bottom breakout at 17. A later buy crossover printed at 10 versus a double-top breakout at 12.
On a second illustrated chart a downward crossover printed at 30 before a double-bottom breakout at 27. A later triple-top buy at 25 was followed by a double bottom at the same price.
On a third illustrated chart a buy crossover printed near 48 or 49. Later double-top and triple-spread-top buys printed at 52 and 55. The overlay stayed aligned with the advance through later pullbacks near 55 and 64 until prices reached at least 68 and then 72. A later sell crossover did not print before a subsequent double-bottom pattern.
What the write-up treated as the change
The write-up treated the entry and exit point differences as modest. It identified staying through later pattern exits as the larger intended change. Other averaging lengths and the standard three-box reversal were left as untested variants.
Yahoo 1×1 point-and-figure with 5- and 10-column midpoint averages
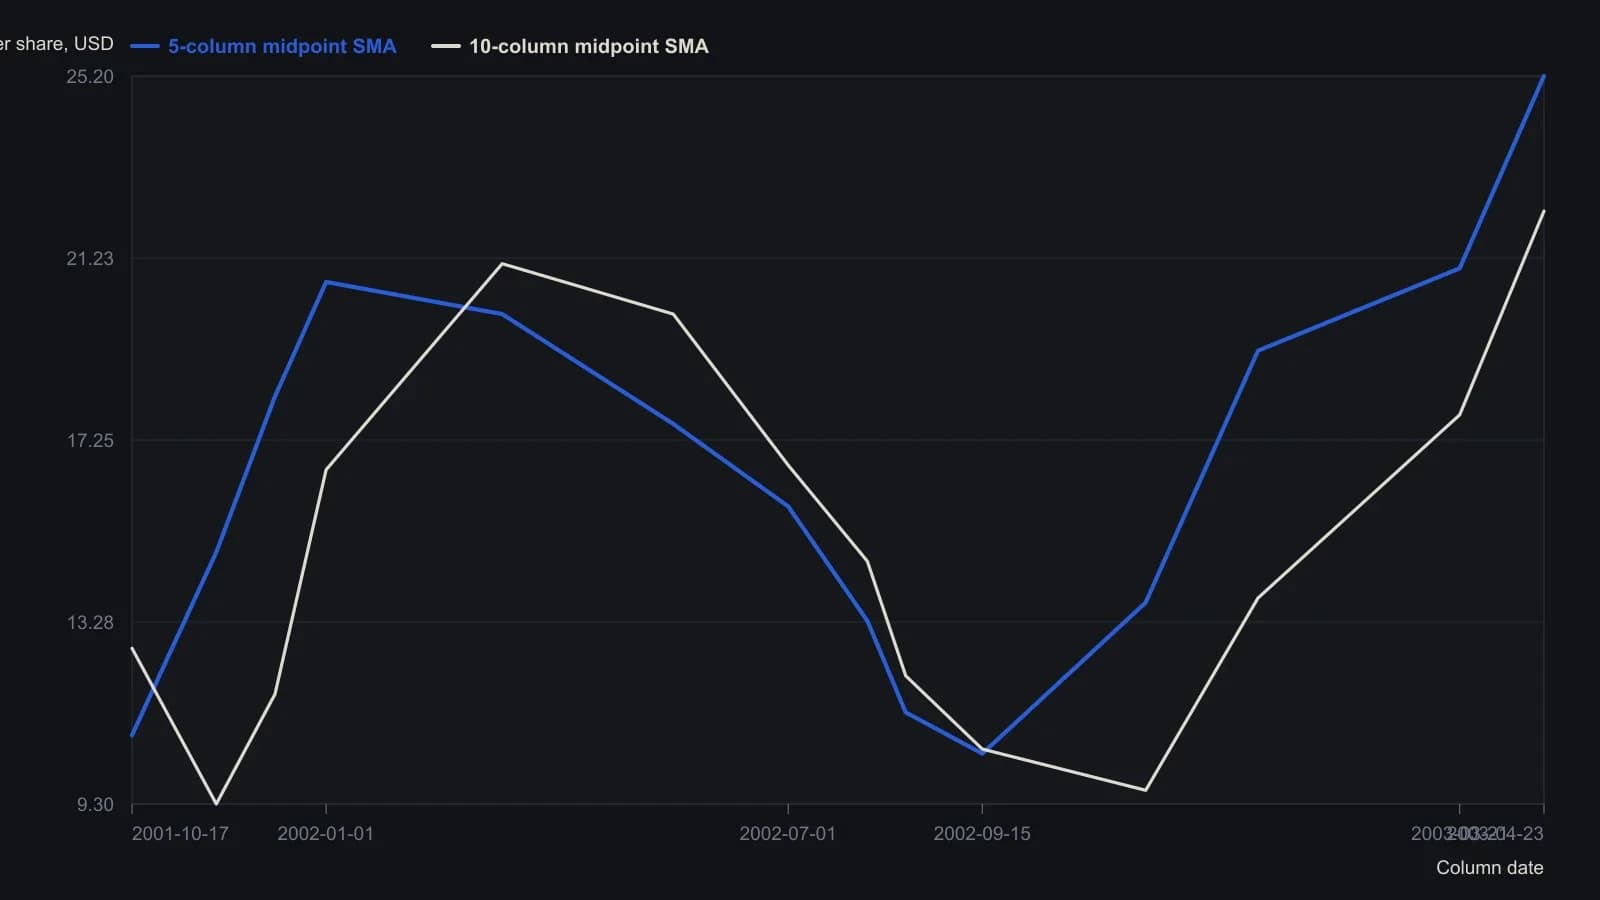
Teseo built both averages on P&F column midpoints ((H+L)/2), not calendar closes, using a one-box reversal with 5- and 10-column lookbacks. Dates are the stamps printed under an irregular column axis. Prices other than the printed 22.25 are approximate raster readings.
All readings on this track · 30 readings
- 1988Constructing trend definitions with filters and lines
- 1989Reversal count as the clock on point-and-figure charts
- 1989Point-and-figure setup and session-average entry windows
- 1989Two-scale point-and-figure trendlines and stop placement
- 1989Adjusted net asset value, tighter reversals, and written stops on a fund point-and-figure chart
- 1990Stack option odds after point-and-figure signals
- 1991Constructing a point-and-figure downtrend-break
- 1991Constructing point-and-figure box and reversal charts
- 1991Constructing a close-tested one-two ladder on a point-and-figure chart
- 1992Point-and-figure, breadth, and volume as falsifiable hypotheses
- 1992Three-gate stock selection with ranks and point and figure
- 1993Constructing combined stochastics and point-and-figure relative strength
- 1997Point-and-figure box scale and reversal construction
- 2000Cotton weekly point-and-figure: late-stage decline, named weekly close
- 2000Constructing point-and-figure charts for support, resistance, and breakouts
- 2001Swiss franc: seasonal permission and a weekly point-and-figure breakout
- 2001Constructing point-and-figure boxes and reversals
- 2002Point-and-figure construction: box, live column, and three-box reversal
- 2003E-mini point-and-figure box-size and a descending-triangle breakout
- 2003A reconstruction critique of point-and-figure daytrading
- 2004Point-and-figure column moving-average crossovers
- 2005Box-series transforms for trend and channel work
- 2006Constructing bearish point-and-figure support breaks
- 2008Point-and-figure forex breakouts and triangles
- 2012From tactile charts to written trade rules
- 2013Combine a Point and figure chart and Moving-average crossover inside one System optimization procedure
- 2015Point-and-figure time and volume limits are conventions to test
- 2016Measurement-first critique of indicator defaults
- 2017Point-and-figure construction, reversals, and column-based overlays
- 2019A 2019 charting case as a three-check trend classroom