1989issue C091-6
Adjusted net asset value, tighter reversals, and written stops on a fund point-and-figure chart
A mutual-fund point-and-figure chart is one step removed from a single-equity print. Distribution-adjusted net asset value keeps the grid continuous, a one-box reversal is what still shows countable columns, and a written stop-loss is what keeps a horizontal-count hypothesis falsifiable when the shares fill only at the next net asset value.
- Mutual-fund net asset value is reduced when distributions are paid, so unadjusted prices break continuity on a point-and-figure grid. The working adjustment adds each distribution back on the ex-dividend date before the plot is built.
- On the same long-term fund series, a one-point three-box reversal showed little usable structure, while a one-point one-box reversal showed more column-by-column structure.
- Horizontal counts across congestion produced numeric price objectives, but the case records scant trendlines and later price paths that did not match those counts.
- The fund could not be shorted or exited with a broker stop-loss, so protective levels stayed personal discipline while fills occurred at market.
A composite series, not a single-equity print
Point-and-figure is a price-only chart that records box moves and reversals so congestion width can be counted into a later price objective. On a mutual fund the same method plots a composite net-asset-value series whose holdings can change, so the chart is one step removed from a single-equity supply-and-demand print.
That construction is meta-point-and-figure: point-and-figure applied to a fund's composite net asset value rather than to a single equity's supply-and-demand print. The editorial reading of this archive case is to treat the fund chart as a delayed classroom. The boxes can still be counted, but the plotted object is not a single listed share.
Keeping the grid continuous
Mutual-fund net asset value is reduced when distributions are paid, so unadjusted prices break continuity on a point-and-figure grid. The working adjustment adds each distribution to net asset value as of the ex-dividend date before the point-and-figure plot is built.
Net-asset-value-adjustment means adding a cash or capital-gains distribution back to net asset value on the ex-dividend date so the plotted series does not gap lower for a non-market reason.
After the period tax-rule change, capital-gains distributions had to be paid in the same year they were earned, which concentrated sizable December net-asset-value declines. An unadjusted December drop would have broken the point-and-figure grid for a reason that was not a market print.
The reversal scale that still shows structure
Box-reversal-scale is the box size and the number of boxes required to start a new column. A looser reversal can erase structure that a one-box reversal still shows.
On the same long-term fund series, a one-point three-box reversal chart showed little usable structure, while a one-point one-box reversal chart showed more column-by-column structure. Editorial note: the tighter scale is what produced a congestion-zone visible enough to count.
Horizontal counts without matching later paths
A congestion-zone is a band of overlapping columns that later serves as a count base, support or resistance, or a place to site a stop. A horizontal-count is a width measurement across a congestion-zone at a chosen price line, used to project a later objective.
Horizontal counts across congestion produced numeric price objectives, but the case repeatedly records scant trendlines and later price paths that did not match those counts. A trendline is a line through successive highs or lows used as independent confirmation. In this case it is often missing until late.
Magellan horizontal counts versus the moves that followed
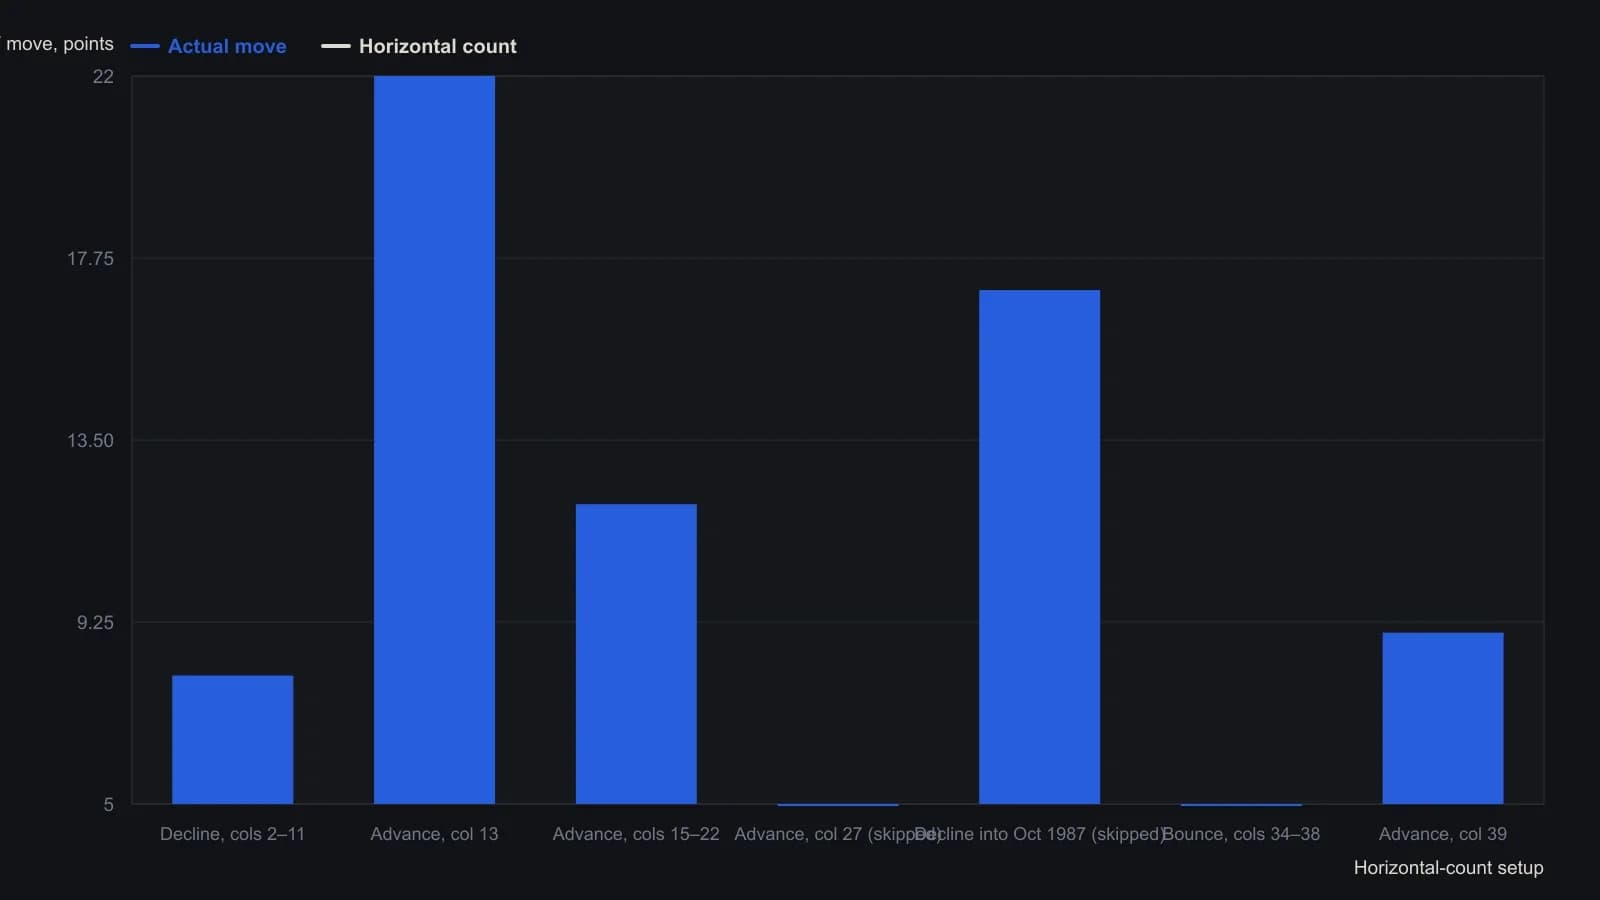
One-point box, one-box reversal, on distribution-adjusted NAV. Stops were written for discipline only; the fund filled at the next net asset value and could not be shorted.
Stops kept as personal discipline
A stop-loss is a precommitted exit level, here set beyond the count base and advanced on a half-retracement rule. Protective levels were first set just beyond the congestion base used for the count, then advanced using a 50-percent pullback from the expected move or the recent high.
The fund vehicle in the case could not be shorted or exited with a broker stop-loss order, so stop levels were kept as personal discipline while fills occurred at market. Market-only-fund-fill is the operational constraint that fund shares are bought and sold at the next net asset value, not with resting stop or short orders.
Late confluence of opposing trendlines
Late in the sequence an uptrend line and a downtrend line approached confluence, so the next price action was expected to break one of the two lines. Two opposing lines can converge so the next print must break one of them.
Editorial note: that late pair is the independent confirmation the earlier horizontal counts largely lacked.
What one fund chart cannot settle
A single-fund case is treated as insufficient to generalize, and fund point-and-figure counts are not expected to behave like counts on a single-equity chart.
All readings on this track · 30 readings
- 1988Constructing trend definitions with filters and lines
- 1989Reversal count as the clock on point-and-figure charts
- 1989Point-and-figure setup and session-average entry windows
- 1989Two-scale point-and-figure trendlines and stop placement
- 1989Adjusted net asset value, tighter reversals, and written stops on a fund point-and-figure chart
- 1990Stack option odds after point-and-figure signals
- 1991Constructing a point-and-figure downtrend-break
- 1991Constructing point-and-figure box and reversal charts
- 1991Constructing a close-tested one-two ladder on a point-and-figure chart
- 1992Point-and-figure, breadth, and volume as falsifiable hypotheses
- 1992Three-gate stock selection with ranks and point and figure
- 1993Constructing combined stochastics and point-and-figure relative strength
- 1997Point-and-figure box scale and reversal construction
- 2000Cotton weekly point-and-figure: late-stage decline, named weekly close
- 2000Constructing point-and-figure charts for support, resistance, and breakouts
- 2001Swiss franc: seasonal permission and a weekly point-and-figure breakout
- 2001Constructing point-and-figure boxes and reversals
- 2002Point-and-figure construction: box, live column, and three-box reversal
- 2003E-mini point-and-figure box-size and a descending-triangle breakout
- 2003A reconstruction critique of point-and-figure daytrading
- 2004Point-and-figure column moving-average crossovers
- 2005Box-series transforms for trend and channel work
- 2006Constructing bearish point-and-figure support breaks
- 2008Point-and-figure forex breakouts and triangles
- 2012From tactile charts to written trade rules
- 2013Combine a Point and figure chart and Moving-average crossover inside one System optimization procedure
- 2015Point-and-figure time and volume limits are conventions to test
- 2016Measurement-first critique of indicator defaults
- 2017Point-and-figure construction, reversals, and column-based overlays
- 2019A 2019 charting case as a three-check trend classroom