2002issue C011-3
Point-and-figure construction: box, live column, and three-box reversal
A point-and-figure chart records rising runs as X columns and falling runs as O columns. A new mark is posted only after price fills a full box, the live column listens only to the high or the low, and a three-box reverse is the usual event that opens an opposite column.
- A box is the smallest increment that must be reached before another X or O may be posted, so smaller fluctuations stay unmarked.
- An active x-column listens only to a new daily high that fills the next box; an active o-column listens only to a new daily low that fills the next box.
- A three-box-reversal opens the opposite column one box in from the prior extreme, then fills marks to the new qualifying high or low.
- Time-independent-posting lets one column cover a day, a week, a month, or longer, with time usually limited to a small month notation.
What the chart records
A point-and-figure chart records a rising run as a column of X marks and a falling run as a column of O marks. It organizes the plot around directional supply-and-demand shifts rather than a bar for every session.
Columns are not bound to the calendar. A single column may cover a day, a week, a month, or longer, and time is usually limited to a small month notation. That is time-independent-posting: columns grow by qualifying price change rather than by calendar session, so one column may span a day or a much longer stretch.
How the live column posts a box
A new X or O is posted only after price travels at least one full box. The box is the smallest price increment that must be reached before another X or O may be posted. In the common stock band from about 20 to 100, that box is typically one point, and smaller fluctuations are left unmarked.
While an x-column is active, only a new daily high that reaches the next box adds another X. While an o-column is active, only a new daily low that reaches the next box adds another O. If neither threshold is met, the chart receives no new mark.
How a three-box reversal is posted
The usual filter for opening an opposite column is a three-box-reversal. Five-box and ten-box filters have also been used when price swings are unusually large.
A downward reversal is posted by moving one column right and one box below the last X, then filling Os down to the new low. An upward reversal is posted by moving one column right and one box above the last O, then filling Xs up to the new high. That reversal-offset starts the reverse column one box in from the extreme. It is meant to put later thrusts through congestion, support, and resistance in higher relief without changing the prices being recorded.
A reversal is recorded only when the opposite move is at least three boxes. After an advance from 48 to 53, a drop to 49.5 equals 3.5 and qualifies, but the lowest O is posted at 50 because 49.5 has not reached the 49 box.
Reading a column extreme after it is posted
Editorial: these rules define when a mark may appear. They do not catalogue patterns. After an x-column or o-column stands, a later break of that column extreme is a supply-demand hypothesis. The next qualifying print can confirm or falsify it. A print that does not fill a box leaves the chart unchanged.
Continuous light crude, three-box point-and-figure
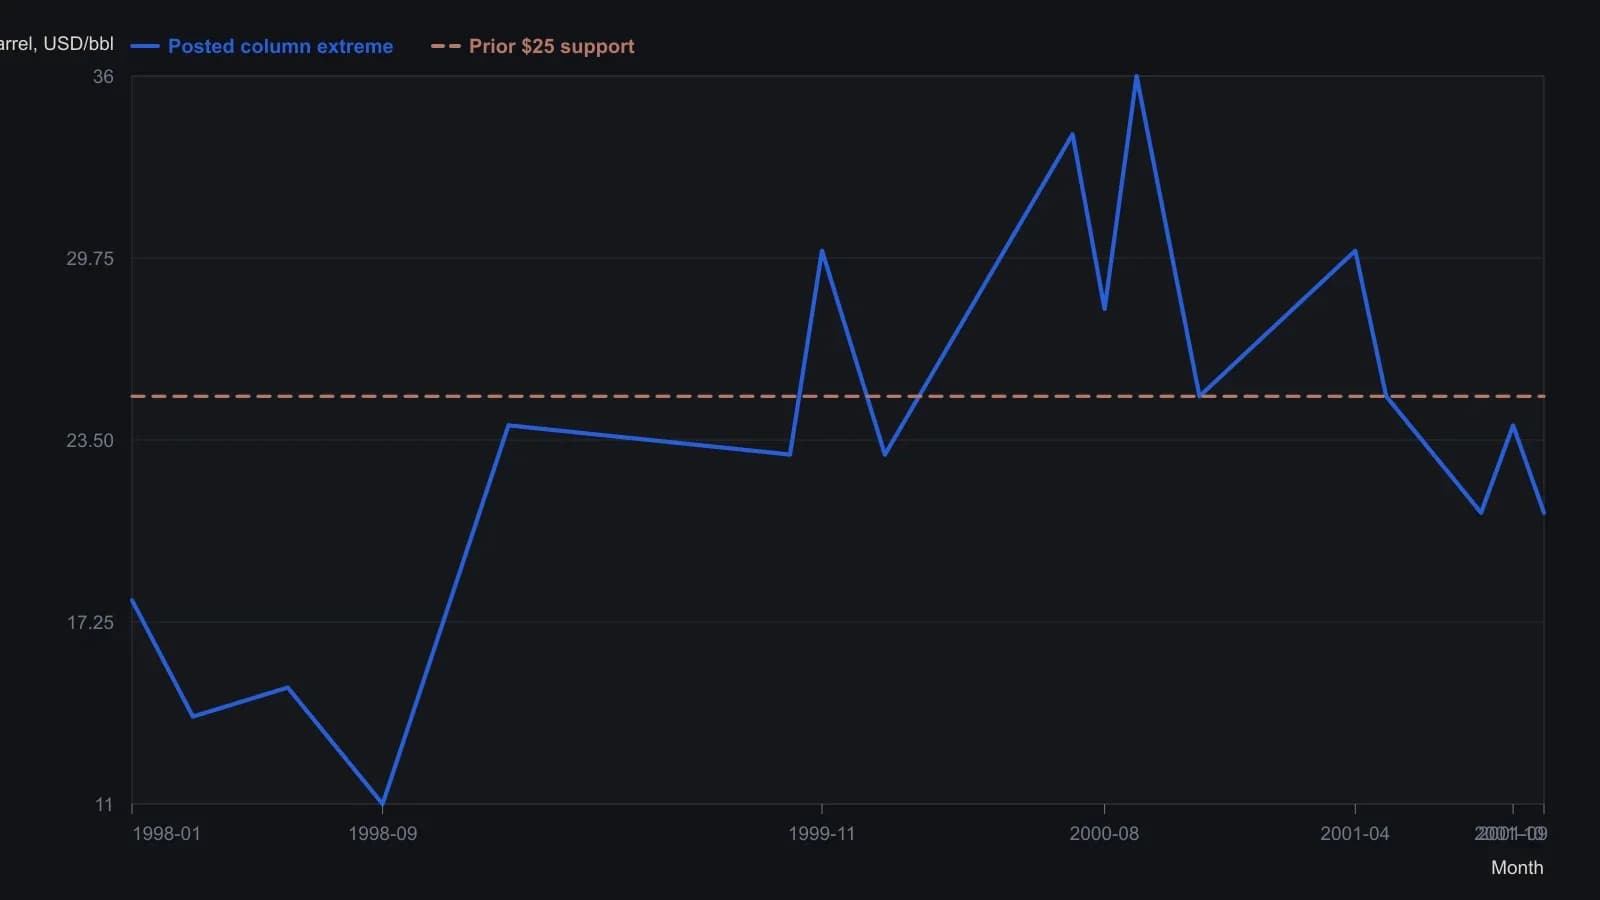
Prices are box levels read from the printed dollar scale to the nearest dollar. Month labels follow the markers on the source; a point-and-figure column is not a fixed calendar bar. The $25 threshold is the support line drawn on the original chart through the late-2000 and 2001 columns.
All readings on this track · 30 readings
- 1988Constructing trend definitions with filters and lines
- 1989Reversal count as the clock on point-and-figure charts
- 1989Point-and-figure setup and session-average entry windows
- 1989Two-scale point-and-figure trendlines and stop placement
- 1989Adjusted net asset value, tighter reversals, and written stops on a fund point-and-figure chart
- 1990Stack option odds after point-and-figure signals
- 1991Constructing a point-and-figure downtrend-break
- 1991Constructing point-and-figure box and reversal charts
- 1991Constructing a close-tested one-two ladder on a point-and-figure chart
- 1992Point-and-figure, breadth, and volume as falsifiable hypotheses
- 1992Three-gate stock selection with ranks and point and figure
- 1993Constructing combined stochastics and point-and-figure relative strength
- 1997Point-and-figure box scale and reversal construction
- 2000Cotton weekly point-and-figure: late-stage decline, named weekly close
- 2000Constructing point-and-figure charts for support, resistance, and breakouts
- 2001Swiss franc: seasonal permission and a weekly point-and-figure breakout
- 2001Constructing point-and-figure boxes and reversals
- 2002Point-and-figure construction: box, live column, and three-box reversal
- 2003E-mini point-and-figure box-size and a descending-triangle breakout
- 2003A reconstruction critique of point-and-figure daytrading
- 2004Point-and-figure column moving-average crossovers
- 2005Box-series transforms for trend and channel work
- 2006Constructing bearish point-and-figure support breaks
- 2008Point-and-figure forex breakouts and triangles
- 2012From tactile charts to written trade rules
- 2013Combine a Point and figure chart and Moving-average crossover inside one System optimization procedure
- 2015Point-and-figure time and volume limits are conventions to test
- 2016Measurement-first critique of indicator defaults
- 2017Point-and-figure construction, reversals, and column-based overlays
- 2019A 2019 charting case as a three-check trend classroom