2012issue C1149-55
From tactile charts to written trade rules
Hand-drawn Point and figure chart work from the high, low, and close was used to name channels, trendlines, compressions, and momentum shifts, then accepted setups were written into a next-session plan that already named entry, invalidation, and profit-taking. TradersWeek editorial reading: the trade was handled as a procedure that could be refused if those names, or a reason to stand aside, were missing.
- Hand-drawn Point and figure chart work from the high, low, and close was used to recognize channels, trendlines, compressions, and momentum-shift conditions.
- Physical limits on short-horizon scalping forced a daily written plan that named entry location, invalidation, and profit-taking before the session.
- Phase classification from a 50-day and a 200-day moving average sat first in that plan, with the cleanest change signal when price and those averages converged.
- TradersWeek editorial reading: a setup was treated as incomplete unless it already named the invalidation, the profit test, and a reason to stand aside.
Tactile charts as named conditions
Hand-drawn Point and figure chart work from the high, low, and close was used to recognize channels, trendlines, compressions, and momentum-shift conditions. The same X-and-O structure was later read as a visual stand-in for crowd psychology at breakouts and breakdowns.
Each evening, accepted pattern setups were written into a next-session plan that could be rechecked as a discipline artifact.
Microsoft daily closes, May to November 2011
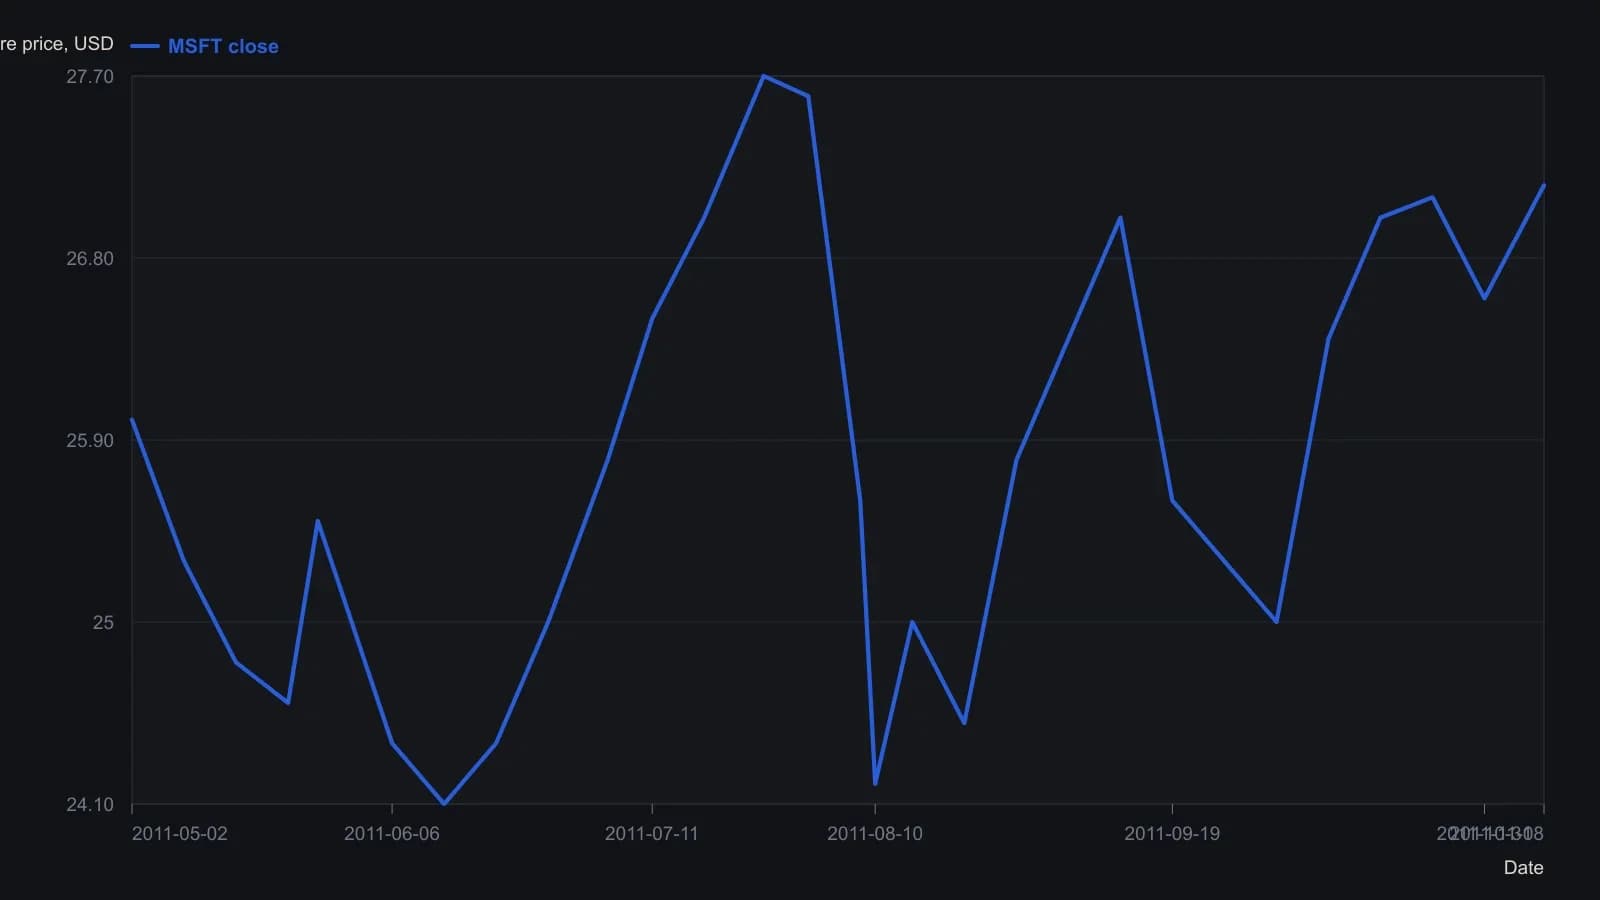
Closes were sampled at the labeled week ticks and at the obvious swing highs and lows. Only the 8 November 2011 close is the printed figure. The S&P 500 overlay and the MSFT:SPX relative-strength pane were left off because this reconstruction uses a single price axis.
A written plan before the session
Physical limits on short-horizon scalping forced a daily written plan that named entry location, invalidation, and profit-taking before the session. TradersWeek editorial mapping treats that plan as a Pre-trade checklist: the session was a check against names already written down, not an open search for action.
The standing risk rule was not to add to losing trades, to add only when momentum already favored the position, and to take profits when that momentum shifted.
Phase, opening range, and the watchlist
Phase classification from the relationship and slope of a 50-day and a 200-day moving average was treated as the first layer of that plan. The cleanest change signal was when price and those averages converged. A price 10 percent or 15 percent away from those averages was treated as a less clean phase-change signal. Fully extended bullish or bearish readings were not treated as the best risk-to-reward spots.
An opening range formed in the first minutes. A later break of that range on a five-minute or thirty-minute window was treated as a directional follow-through hypothesis.
Live work watched about 25 to 30 charts and narrowed them to a top 10. Volume spikes were read as urgency. Sideways action was read as inactivity.
The same procedure after the floor
After leaving the floor, the same procedure still required a written plan, recognition of hope, fear, and greed, and a filter between rumor, news, expectation, and realized reaction. TradersWeek editorial mapping treats that filter as the Trading psychology process in this record: a check that rumor and expectation were not substituted for the written plan or for the market's realized reaction.
All readings on this track · 30 readings
- 1988Constructing trend definitions with filters and lines
- 1989Reversal count as the clock on point-and-figure charts
- 1989Point-and-figure setup and session-average entry windows
- 1989Two-scale point-and-figure trendlines and stop placement
- 1989Adjusted net asset value, tighter reversals, and written stops on a fund point-and-figure chart
- 1990Stack option odds after point-and-figure signals
- 1991Constructing a point-and-figure downtrend-break
- 1991Constructing point-and-figure box and reversal charts
- 1991Constructing a close-tested one-two ladder on a point-and-figure chart
- 1992Point-and-figure, breadth, and volume as falsifiable hypotheses
- 1992Three-gate stock selection with ranks and point and figure
- 1993Constructing combined stochastics and point-and-figure relative strength
- 1997Point-and-figure box scale and reversal construction
- 2000Cotton weekly point-and-figure: late-stage decline, named weekly close
- 2000Constructing point-and-figure charts for support, resistance, and breakouts
- 2001Swiss franc: seasonal permission and a weekly point-and-figure breakout
- 2001Constructing point-and-figure boxes and reversals
- 2002Point-and-figure construction: box, live column, and three-box reversal
- 2003E-mini point-and-figure box-size and a descending-triangle breakout
- 2003A reconstruction critique of point-and-figure daytrading
- 2004Point-and-figure column moving-average crossovers
- 2005Box-series transforms for trend and channel work
- 2006Constructing bearish point-and-figure support breaks
- 2008Point-and-figure forex breakouts and triangles
- 2012From tactile charts to written trade rules
- 2013Combine a Point and figure chart and Moving-average crossover inside one System optimization procedure
- 2015Point-and-figure time and volume limits are conventions to test
- 2016Measurement-first critique of indicator defaults
- 2017Point-and-figure construction, reversals, and column-based overlays
- 2019A 2019 charting case as a three-check trend classroom