2014issue C0736-40
RSI, CCI, and moving-average trend-filter construction
This article reconstructs how a same-length relative strength index is mapped to moving-average slope through the fifty-line, how a smoother of that RSI is used to test persistence, and how a commodity channel overlay measures acceleration away from the RSI average. Editorial framing treats those steps as one three-layer trend filter.
- A same-length RSI reading at or above 50 is treated as the counterpart of a positive moving-average slope, and a reading below 50 as the counterpart of a negative slope.
- A 100-day average of RSI(200) is used as a major-trend identifier that tests whether a fifty-line crossing persists, rather than as a replacement for the price moving average.
- A same-length commodity channel index applied to RSI, with typical price replaced by the indicator close, measures how far RSI is accelerating away from its own average.
- An outer five-percent zone on a long RSI, illustrated at 54.7 on RSI(300), is used to confirm statistically unusual trend strength after the slope question has already been answered.
Slope, duration, and acceleration as separate questions
A same-length relative strength index reading at or above 50 is treated as the counterpart of a positive moving-average slope, and a reading below 50 as the counterpart of a negative slope. The fifty-line is the RSI midline used to mark whether a moving average of matching lookback has a positive or negative slope.
The moving average remains the lagged smoother of past observations that serves as the classic trend baseline. The archive then compares RSI and commodity channel constructions against that reference line rather than discarding it.
Editorial interpretation: teach this as a three-layer trend filter. First map same-length RSI to moving-average slope. Next smooth that RSI to test whether the slope persists. Then wrap a commodity-channel deviation around the RSI-to-average gap so slope, duration, and acceleration stay separate questions inside one bounded-indicator family.
Same-length RSI as a slope detector
The relative strength index is a bounded price-velocity oscillator. In this construction its position versus the fifty-line is treated as a same-length slope detector, not only as a range-bound overbought or oversold gauge.
In a four-year SPY window around 2007 to 2010, turns in a 200-day simple moving average coincide with RSI(200) crossing the 50 level. That historical coincidence is the archive reason for pairing the two lookbacks.
Why a short RSI is treated as a range tool
The familiar 14-bar RSI length is described as too short to mark major trends. That short lookback helps explain why RSI is often treated as a range-bound rather than a trend tool.
SPY 200-day SMA slope vs RSI(200) around 2008–09
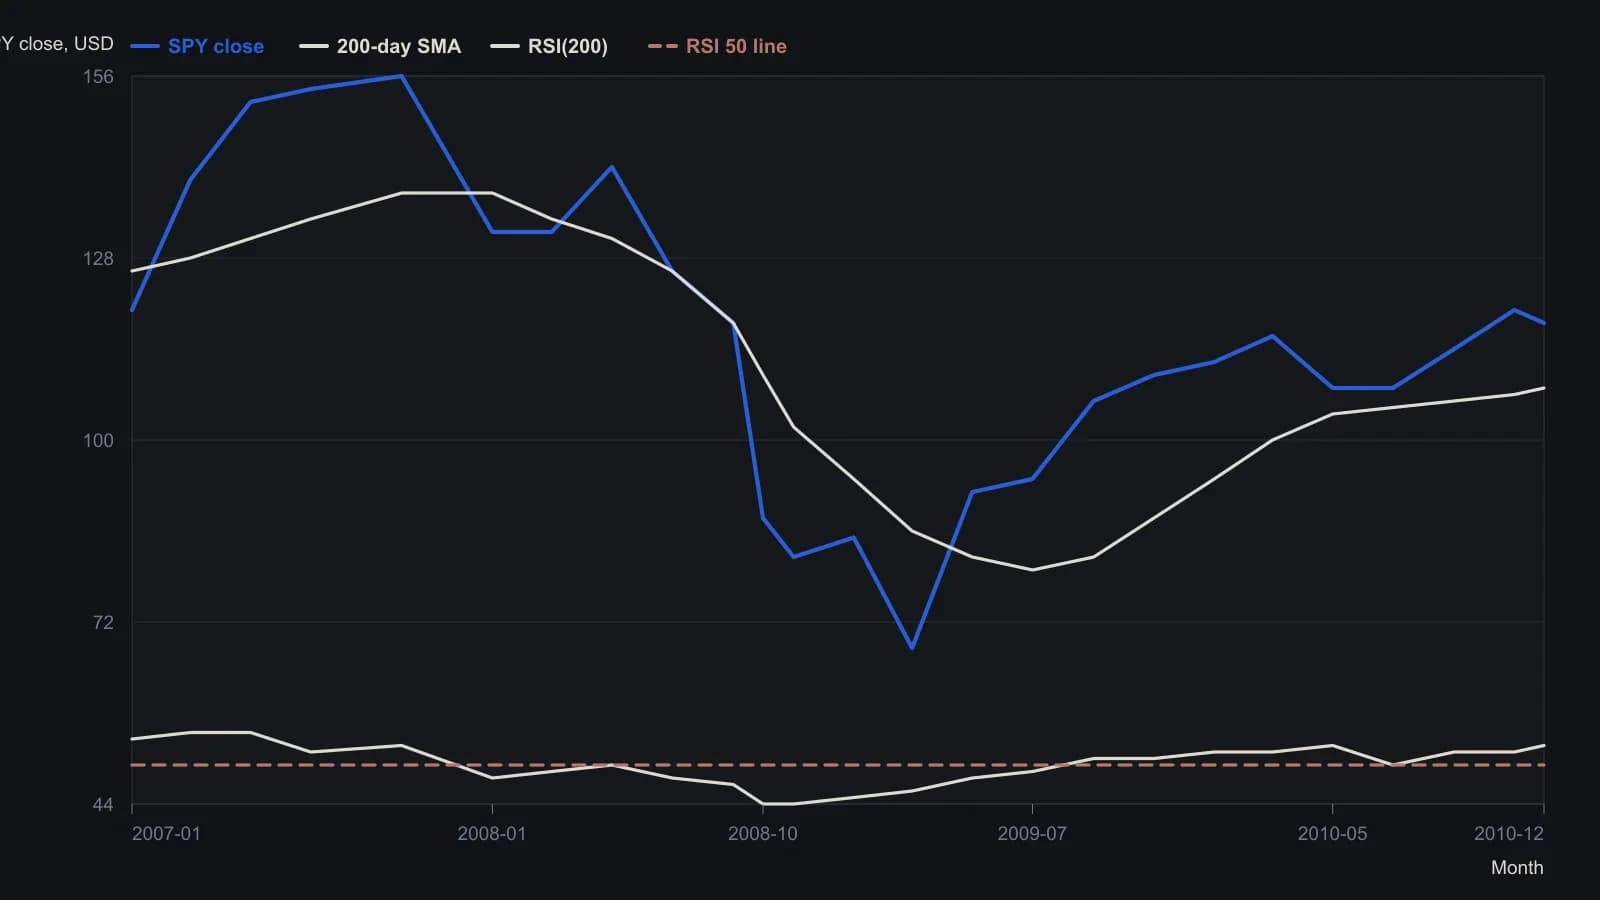
Same 200-bar length on SMA and RSI. The 50 line is the slope detector: RSI(200) above 50 maps to a positive SMA slope, below 50 to a negative slope. Bearish window is contained between A and B. Values read off the raster, so they are approximate.
A smoother of RSI as a major-trend identifier
A 100-day average of RSI(200) is constructed as a major-trend identifier. That RSI moving average is a smoother of RSI itself, used to test whether a fifty-line crossing persists as a major trend instead of a brief slope reversal.
In a 20-year SPY illustration that average showed no highlighted whipsaws, while the 100-day and 200-day price averages showed three.
A more sensitive RSI-to-average plot
Plotting RSI(200) against its own 200-day average is presented as a more sensitive construction whose illustrated crossovers occurred earlier than the matching price moving-average crossovers. The price moving average stays the baseline. The RSI-to-average plot is the comparison, not a replacement definition of the average.
Commodity channel index on RSI
Overlaying a same-length commodity channel index on RSI is used to measure how far RSI is accelerating away from its moving average. The commodity channel index is a mean-deviation oscillator that can travel beyond its default rails and, when applied to RSI, measures that acceleration.
When CCI is applied to an indicator such as RSI, the typical-price input is replaced by the indicator close. Typical price is the high-low-close average that is the usual CCI input.
Rescaling the CCI rails
After converting the mean-absolute-deviation CCI scale to a z-score, the plus or minus 137 levels enclose 90 percent of readings, whereas the default plus or minus 100 levels enclose about 77 percent. Mean absolute deviation is the scale in the CCI denominator, related to standard deviation by a factor of about 0.7979 under a normal-distribution assumption.
Confirming strength with a five-percent zone
On a multi-year GLD window, RSI(300) visiting the upper five-percent zone, illustrated at 54.7, and remaining above 50 is used to confirm an uptrend in a way the 300-day averages alone do not provide. The five-percent zone is an outer RSI tail, illustrated as a 90 percent confidence bound, used to confirm statistically unusual trend strength rather than only to detect a slope change.
In that same GLD construction, an early-2012 advance that held above 50 but did not re-enter the five-percent zone is marked as unconfirmed, and a downtrend is marked as confirmed in May 2013.
All readings on this track · 39 readings
- 1982Three gates on a 1982 pork-belly short
- 1982Scale-free Commodity Channel Index construction
- 1986Constructing a commodity channel index and a regression price channel
- 1987Constructing scaled OHLC matrices for study overlays
- 1987Constructing the commodity channel, average directional, and relative strength indexes on a shared cycle scale
- 1992Eleven-bar commodity channel index from typical price and mean deviation
- 1992Evaluating Commodity Channel Index breakout versus range rules
- 1992Evaluating breakout and CCI rules as complete mechanical procedures
- 1993Constructing stochastic, RSI and CCI inputs for forecasts
- 1993Nested centered channels with a commodity channel index confirmation gate
- 1993Listed-option timing as three separable clocks
- 1994Constructing an eleven-period commodity channel index
- 1994Confirming Elliott wave turns with channels and the commodity channel index
- 1995Commodity Channel Index band rules lag zero-line timing
- 1995Building the commodity channel index from typical price
- 1995Staged reversal rules with commodity channel index and average channels
- 1995Commodity channel index construction from typical price to a smoothed zero line
- 2001Reader tests for unfinished lookback oscillators
- 2002Constructing the commodity channel index from typical price
- 2003Breadth-filtered commodity channel index entry and exit rules
- 2003Constructing the Commodity Channel Index from typical price and scaled deviation
- 2003A shallow, poorly participated advance is an unconfirmed trend
- 2003CCI and RSI parameter defaults as scaling conventions
- 2003A cost and capital audit of a Commodity Channel Index trade engine
- 2003Commodity channel index peak divergence as an exit after twin patterns
- 2004Constructing the Commodity Channel Index from typical price
- 2004Constructing the Commodity Channel Index from typical price and mean deviation
- 2006Building custom indicators from the Commodity Channel Index, a least squares moving average and a rule-based entry
- 2012Confirming breakouts and retracements with CCI, ADX, and averages
- 2012Stacking oscillator lookbacks into a heatmap mosaic
- 2013Constructing a consensus and volatility-normalized value oscillator
- 2013Walk-forward system evaluation with a commodity channel index and chandelier exits
- 2014Dual detrended oscillators and dual Bollinger Band channels
- 2014RSI, CCI, and moving-average trend-filter construction
- 2014Dual RSI, a moving average, and CCI as a confirmation stack
- 2017Constructing dual-average cross and channel-index filters
- 2018Treat CAM as a classification layer before confirmation becomes an entry
- 2018Four-state slope labels gated by a moving average and a commodity channel index
- 2018Deviation-Scaled Moving Average construction from a two-bar difference