2013issue C0142-45
Constructing a consensus and volatility-normalized value oscillator
The relative strength index and the stochastic oscillator are classical attempts at short-term relative valuation. This article reviews that construction, then rebuilds a reading that recenters each bar on a few-period consensus and scales it by true-range volatility.
- The relative strength index and the stochastic oscillator are presented as classical tools for a short-term relative valuation of a price series.
- Range-compression oscillators squeeze a path into a fixed interval and tend to stay pinned at the extremes while a strong trend continues.
- Absolute price cannot be the valuation input, because a one-unit change is a larger volatility event for a lower-priced instrument than for a higher-priced one.
- Subtracting a few-period midpoint consensus and dividing by a short average of true range yields a volatility-normalized oscillator reading.
Classical tools for short-term valuation
The relative strength index and the stochastic oscillator are presented as classical tools that attempt a short-term relative valuation of an underlying price series. The relative strength index is a range-compression oscillator that maps ordered prices into a fixed interval so short-horizon strength can be read as a valuation score. The stochastic oscillator places the latest close inside a lookback high-low window to express short-term relative valuation.
The commodity channel index is a lookback oscillator that scales the gap between price and a typical-price average by mean deviation. It is retained here as a construction peer for centered valuation readings.
Range compression, stickiness, and lag
Range-compression oscillators such as the relative strength index squeeze a price path into a fixed interval, commonly 0 to 100 or -1 to +1. During strong trends they tend to remain pinned near their interval extremes because most of the bounded range is reserved for short-term reactions. That stickiness produces prolonged overbought or oversold readings while the trend continues.
Smoothing oscillators inherit the lag of the moving averages they are built from. Parameterized oscillators introduce subjectivity that can encourage curve-fitting in backtests.
Why absolute price cannot be the input
A one-unit price change is treated as a larger volatility event for a 5-priced instrument than for a 50-priced instrument, so absolute price cannot serve as the valuation input.
Recentering around a short-term consensus
A short-horizon consensus is defined as an x-period moving average of each bar midpoint, computed as the average of that bar high and low, with x kept to only a few periods. Subtracting that consensus from the open, high, low, and close recenters each bar around a straight zero line while preserving the bar relative position to the consensus.
If price rises and then holds the new level, a consensus-based oscillator is specified to fade rather than stay elevated, because that new level becomes the short-term consensus.
Scaling by true-range volatility
True range is the difference between true high and true low. True high is the larger of the current high and the prior close. True low is the smaller of the current low and the prior close.
Dividing the recentered open-high-low-close values by an x-period simple moving average of true range yields a volatility-normalized series. The adjusted close of that series is the constructed oscillator reading for that period.
What the construction checks
Editorial reading: the historical workflow is a design check, not a claim that a consensus and volatility-normalized reading replaces the relative strength index, the stochastic oscillator, or the commodity channel index. It asks whether the valuation score is a recentered, locally scaled series or a compressed path that can pin or lag.
Chartmill value indicator on SPDR S&P 500, daily
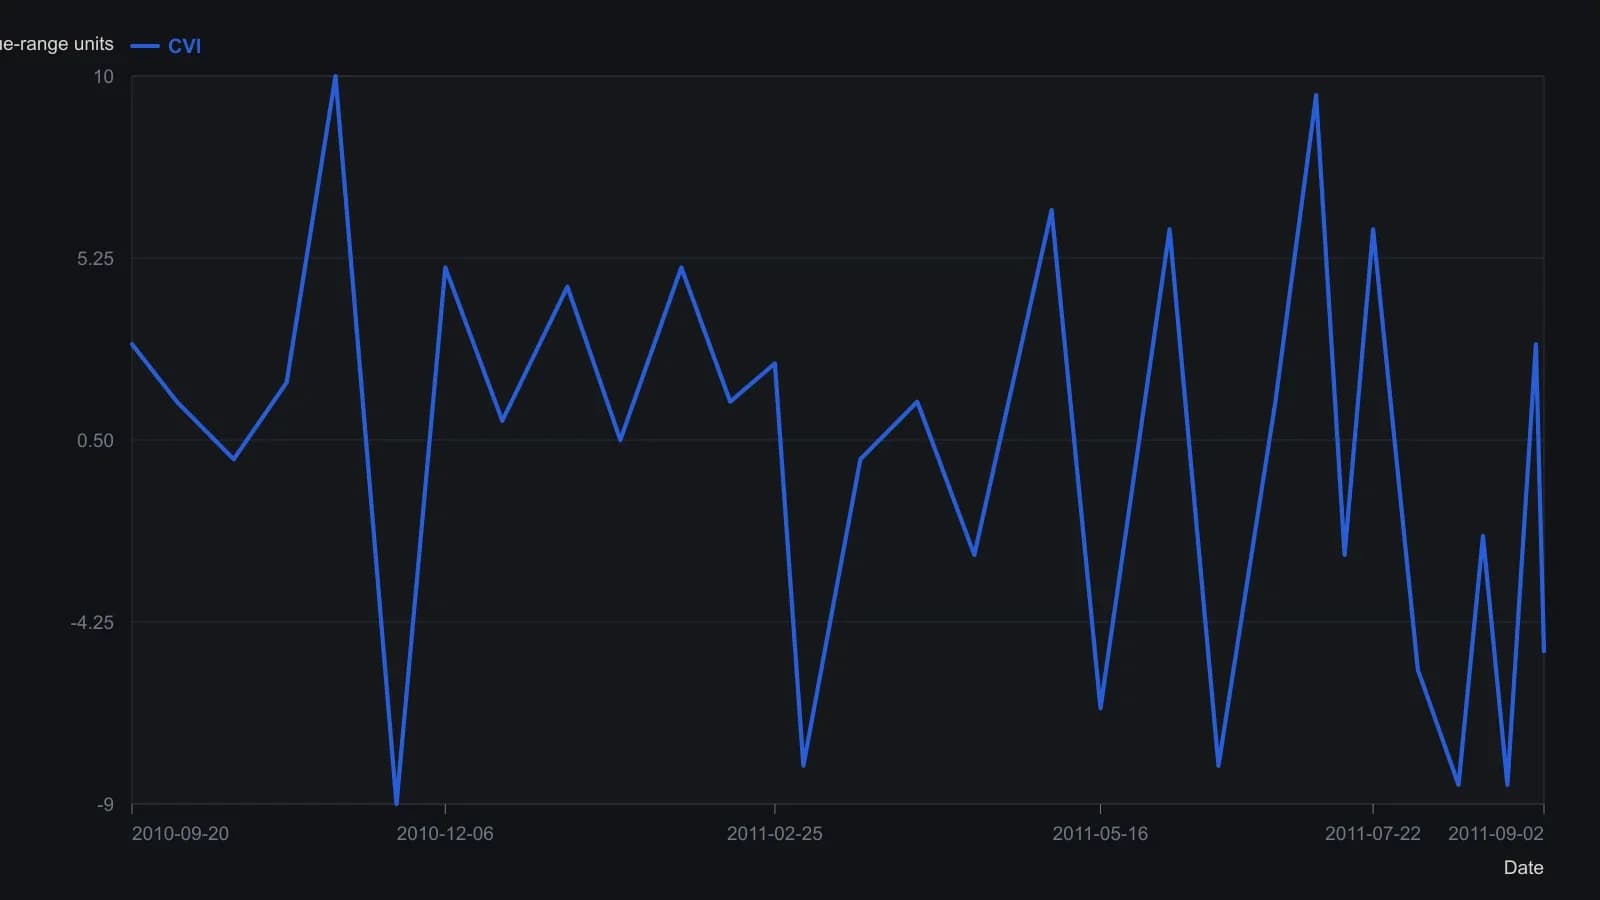
All points except the printed last reading (-5.01) are digitized from the raster and rounded to half a true-range unit. The source does not print the consensus lookback on this pane; the article only says to keep that window to a few bars.
All readings on this track · 39 readings
- 1982Three gates on a 1982 pork-belly short
- 1982Scale-free Commodity Channel Index construction
- 1986Constructing a commodity channel index and a regression price channel
- 1987Constructing scaled OHLC matrices for study overlays
- 1987Constructing the commodity channel, average directional, and relative strength indexes on a shared cycle scale
- 1992Eleven-bar commodity channel index from typical price and mean deviation
- 1992Evaluating Commodity Channel Index breakout versus range rules
- 1992Evaluating breakout and CCI rules as complete mechanical procedures
- 1993Constructing stochastic, RSI and CCI inputs for forecasts
- 1993Nested centered channels with a commodity channel index confirmation gate
- 1993Listed-option timing as three separable clocks
- 1994Constructing an eleven-period commodity channel index
- 1994Confirming Elliott wave turns with channels and the commodity channel index
- 1995Commodity Channel Index band rules lag zero-line timing
- 1995Building the commodity channel index from typical price
- 1995Staged reversal rules with commodity channel index and average channels
- 1995Commodity channel index construction from typical price to a smoothed zero line
- 2001Reader tests for unfinished lookback oscillators
- 2002Constructing the commodity channel index from typical price
- 2003Breadth-filtered commodity channel index entry and exit rules
- 2003Constructing the Commodity Channel Index from typical price and scaled deviation
- 2003A shallow, poorly participated advance is an unconfirmed trend
- 2003CCI and RSI parameter defaults as scaling conventions
- 2003A cost and capital audit of a Commodity Channel Index trade engine
- 2003Commodity channel index peak divergence as an exit after twin patterns
- 2004Constructing the Commodity Channel Index from typical price
- 2004Constructing the Commodity Channel Index from typical price and mean deviation
- 2006Building custom indicators from the Commodity Channel Index, a least squares moving average and a rule-based entry
- 2012Confirming breakouts and retracements with CCI, ADX, and averages
- 2012Stacking oscillator lookbacks into a heatmap mosaic
- 2013Constructing a consensus and volatility-normalized value oscillator
- 2013Walk-forward system evaluation with a commodity channel index and chandelier exits
- 2014Dual detrended oscillators and dual Bollinger Band channels
- 2014RSI, CCI, and moving-average trend-filter construction
- 2014Dual RSI, a moving average, and CCI as a confirmation stack
- 2017Constructing dual-average cross and channel-index filters
- 2018Treat CAM as a classification layer before confirmation becomes an entry
- 2018Four-state slope labels gated by a moving average and a commodity channel index
- 2018Deviation-Scaled Moving Average construction from a two-bar difference