2012issue C0212-21
Confirming breakouts and retracements with CCI, ADX, and averages
A four-role confirmation drill uses a moving-average channel to locate price, the commodity channel index to date momentum, the average directional index to color trend strength, and a volume extreme only to ratify an unusual bar.
- Chart work is multidimensional, so a single indicator is not expected to supply a complete read of price behavior.
- A moving-average channel locates price, the commodity channel index dates momentum, the average directional index colors trend strength, and a volume extreme only ratifies an unusual bar.
- An agreement rule asks whether the commodity channel index and the moving-average channel describe the same regime before a breakout or pullback is treated as context.
- A return of colored bars to the default color means the average directional index is no longer rising and the close is no longer beyond the short moving average. The stack is a decision template, not a complete trading system.
Four roles instead of one reading
Chart work is treated as multidimensional, so a single indicator is not expected to supply a complete read of price behavior. Indicator choice is organized into four roles: trend, momentum, volatility, and volume.
Editorial: TradersWeek treats that split as a four-role template, a chart layout that assigns separate jobs so no single reading has to carry the whole decision. The drill below is indicator hygiene. A moving-average channel locates price, the commodity channel index dates momentum, the average directional index colors trend strength, and a volume extreme only ratifies an unusual bar.
How the stack is arranged
The illustrated stack places the commodity channel index in an upper panel, a moving-average channel on the price bars, a volume oscillator in a narrow panel below price, and average directional index strength as bar color against a short moving average.
The moving-average channel
A moving average here is a lookback smoother of typical price, closes, ranges, or volume. It supplies the channel midline, the short-term direction test, the commodity channel index baseline, and the volume-extreme comparison.
The channel used here substitutes 20-period simple averages of typical price and of the high-to-low range for the original 10-period lengths, so location in the upper or lower band also locates price versus that 20-period moving average.
Price beyond the outer channel lines is read as a breakout or potential trend. Price remaining between the lines is read as sideways action. The same bands are used as support or resistance during pullbacks.
Editorial: that envelope is the keltner-channel job in the four-role template, a volatility envelope around a moving average of typical price that marks breakouts, containment, and pullback levels.
The commodity channel index
The commodity channel index is a momentum oscillator that places current price against mean deviation from a moving average and crosses a zero line that corresponds to that average.
It is applied as a 13-period oscillator around a zero line based on mean, not standard, deviation from a moving average. A zero-line cross is read as price crossing that 13-period average, and readings beyond +100 or -100 are treated as extremes.
Agreement between oscillator and channel
The operating check looks for agreement between the commodity channel index's side of zero and whether price has broken the moving-average channel. A pullback may take the oscillator through zero while price remains inside the bands.
That agreement rule is a confirmation check that asks whether the commodity channel index and the moving-average channel describe the same regime before a breakout or pullback is treated as context.
Lululemon daily price versus Keltner channel
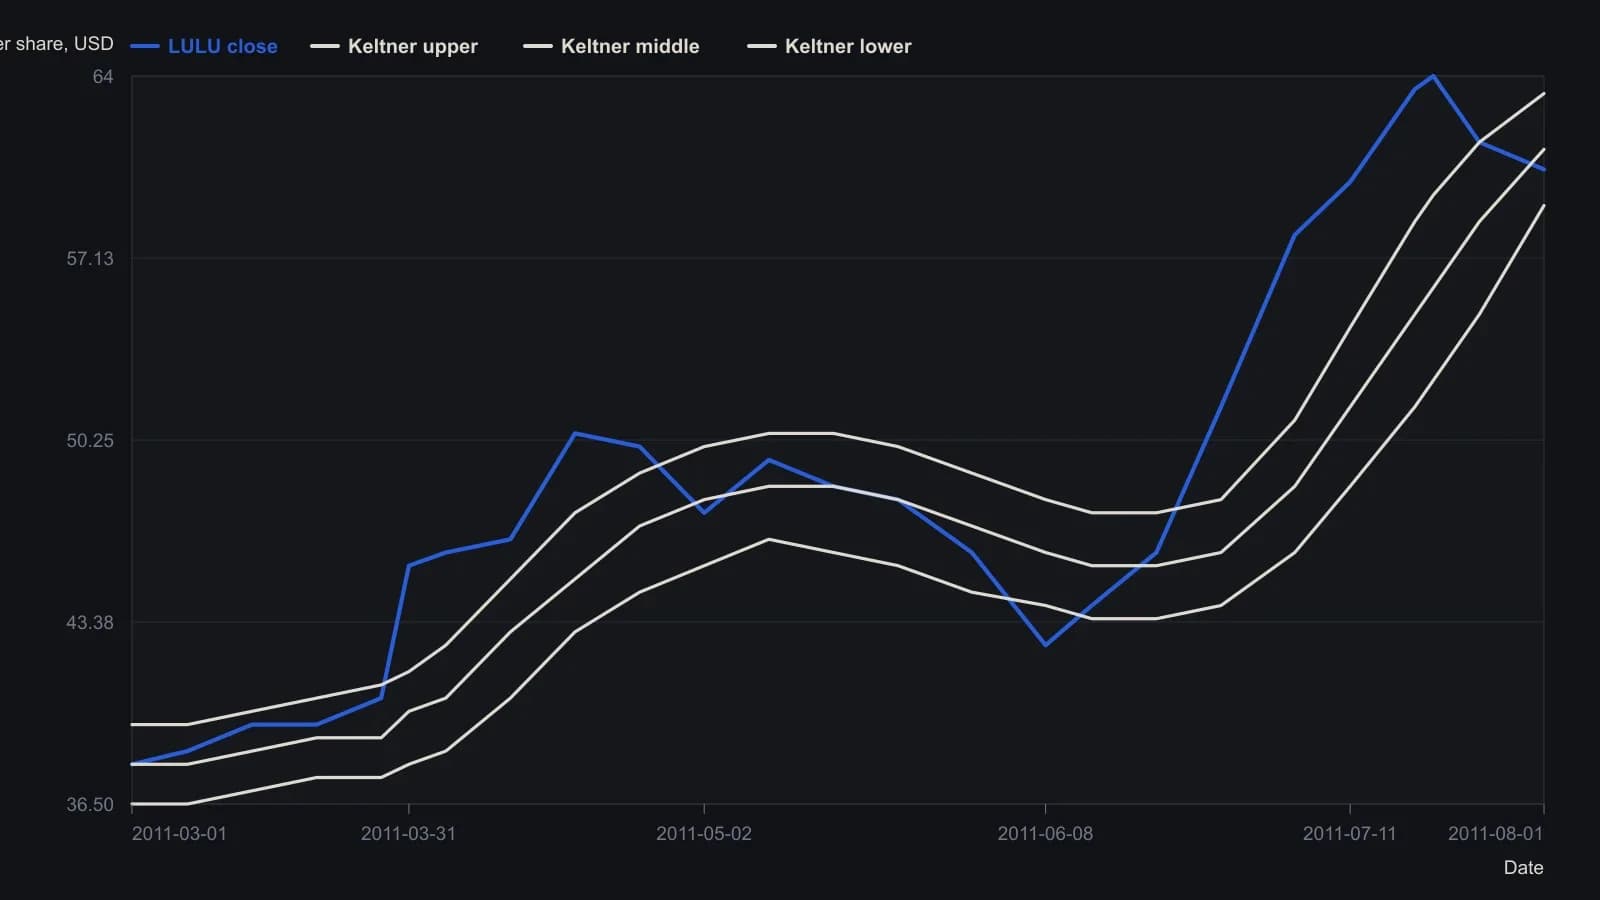
The source’s Keltner uses a 20-period simple average of typical price and a 20-period average of the high–low range, not the Raschke ATR version. Points other than the printed last quote are digitized to the nearest half-dollar.
Bar color from trend strength
The average directional index is a nondirectional trend-strength reading that is interpreted only after it is paired with a short moving-average comparison. A 10-period average directional index is treated as nondirectional strength and is paired with an eight-period simple moving average of the close.
Rising strength with a close above that average marks bars one color, and a close below marks the opposite color. A return of colored bars to the default color means the 10-period average directional index is no longer rising and the close is no longer beyond the eight-period moving average.
That color-alert is a bar-color change driven by rising average directional index plus a close beyond a short moving average, with a return to the default color read as fading strength.
Volume extremes
Volume is reduced to extremes by subtracting a one-period simple moving average of volume from a 20-period simple moving average. Spikes are described as typically appearing above +50.
Editorial: the volume oscillator is a two-length volume comparison used to flag unusually large participation as spikes rather than as a continuous overlay. It only ratifies an unusual bar.
What the stack is for
The stack is presented as a decision template for breakouts and retracements in trending conditions, not as a complete trading system, and as a poor fit when price rarely leaves the channel.
All readings on this track · 39 readings
- 1982Three gates on a 1982 pork-belly short
- 1982Scale-free Commodity Channel Index construction
- 1986Constructing a commodity channel index and a regression price channel
- 1987Constructing scaled OHLC matrices for study overlays
- 1987Constructing the commodity channel, average directional, and relative strength indexes on a shared cycle scale
- 1992Eleven-bar commodity channel index from typical price and mean deviation
- 1992Evaluating Commodity Channel Index breakout versus range rules
- 1992Evaluating breakout and CCI rules as complete mechanical procedures
- 1993Constructing stochastic, RSI and CCI inputs for forecasts
- 1993Nested centered channels with a commodity channel index confirmation gate
- 1993Listed-option timing as three separable clocks
- 1994Constructing an eleven-period commodity channel index
- 1994Confirming Elliott wave turns with channels and the commodity channel index
- 1995Commodity Channel Index band rules lag zero-line timing
- 1995Building the commodity channel index from typical price
- 1995Staged reversal rules with commodity channel index and average channels
- 1995Commodity channel index construction from typical price to a smoothed zero line
- 2001Reader tests for unfinished lookback oscillators
- 2002Constructing the commodity channel index from typical price
- 2003Breadth-filtered commodity channel index entry and exit rules
- 2003Constructing the Commodity Channel Index from typical price and scaled deviation
- 2003A shallow, poorly participated advance is an unconfirmed trend
- 2003CCI and RSI parameter defaults as scaling conventions
- 2003A cost and capital audit of a Commodity Channel Index trade engine
- 2003Commodity channel index peak divergence as an exit after twin patterns
- 2004Constructing the Commodity Channel Index from typical price
- 2004Constructing the Commodity Channel Index from typical price and mean deviation
- 2006Building custom indicators from the Commodity Channel Index, a least squares moving average and a rule-based entry
- 2012Confirming breakouts and retracements with CCI, ADX, and averages
- 2012Stacking oscillator lookbacks into a heatmap mosaic
- 2013Constructing a consensus and volatility-normalized value oscillator
- 2013Walk-forward system evaluation with a commodity channel index and chandelier exits
- 2014Dual detrended oscillators and dual Bollinger Band channels
- 2014RSI, CCI, and moving-average trend-filter construction
- 2014Dual RSI, a moving average, and CCI as a confirmation stack
- 2017Constructing dual-average cross and channel-index filters
- 2018Treat CAM as a classification layer before confirmation becomes an entry
- 2018Four-state slope labels gated by a moving average and a commodity channel index
- 2018Deviation-Scaled Moving Average construction from a two-bar difference