2002issue C041-2
Constructing the commodity channel index from typical price
The commodity channel index is assembled from typical price, a simple lookback average, and mean deviation. The finished scaled score uses a conventional plus-or-minus 100 band to mark unusually large deviations from that lookback mean.
- The commodity channel index is assembled in five arithmetic steps that turn typical price, a lookback average, and mean deviation into a scaled score.
- Typical price is the high, low, and close summed and divided by three, not the close alone.
- Lookback length is a free parameter: a shorter window is described as producing more false crossings, and a longer window as omitting or delaying crossings.
- Readings are described as usually staying inside a plus-or-minus 100 range, with moves beyond that range treated as unusually large deviations from the lookback mean.
How the score is assembled
The commodity channel index is a scaled score of how far a bar's typical price sits from its lookback simple average, using mean deviation in the denominator.
The indicator is assembled in five arithmetic steps: typical price, a simple average of those prices, signed deviations from that average, a mean deviation of the absolute deviations, and a ratio that divides the signed deviation by a scaled mean deviation.
Typical price is not the close
Typical price is the high, low, and close summed and divided by three, not the close alone. The later simple average, the signed deviations, and the mean deviation are all taken from this three-part typical price rather than from the close.
Mean deviation in the denominator
Mean deviation is the average of the absolute differences between each typical price in the lookback window and the window's simple average.
The finished reading is the signed typical-price deviation divided by mean deviation multiplied by 0.015.
What a high or low reading means
A high reading means typical price is elevated relative to its lookback average. A low reading means typical price is depressed relative to that average.
Readings are described as usually staying inside a plus-or-minus 100 range, with moves beyond that range treated as unusually large deviations from the lookback mean. The plus-or-minus 100 band is the conventional envelope around that zero-centered reading.
The same construction is presented as usable on commodity, equity, or other price series.
Eleven-day CCI on the Dow, January–February 1993
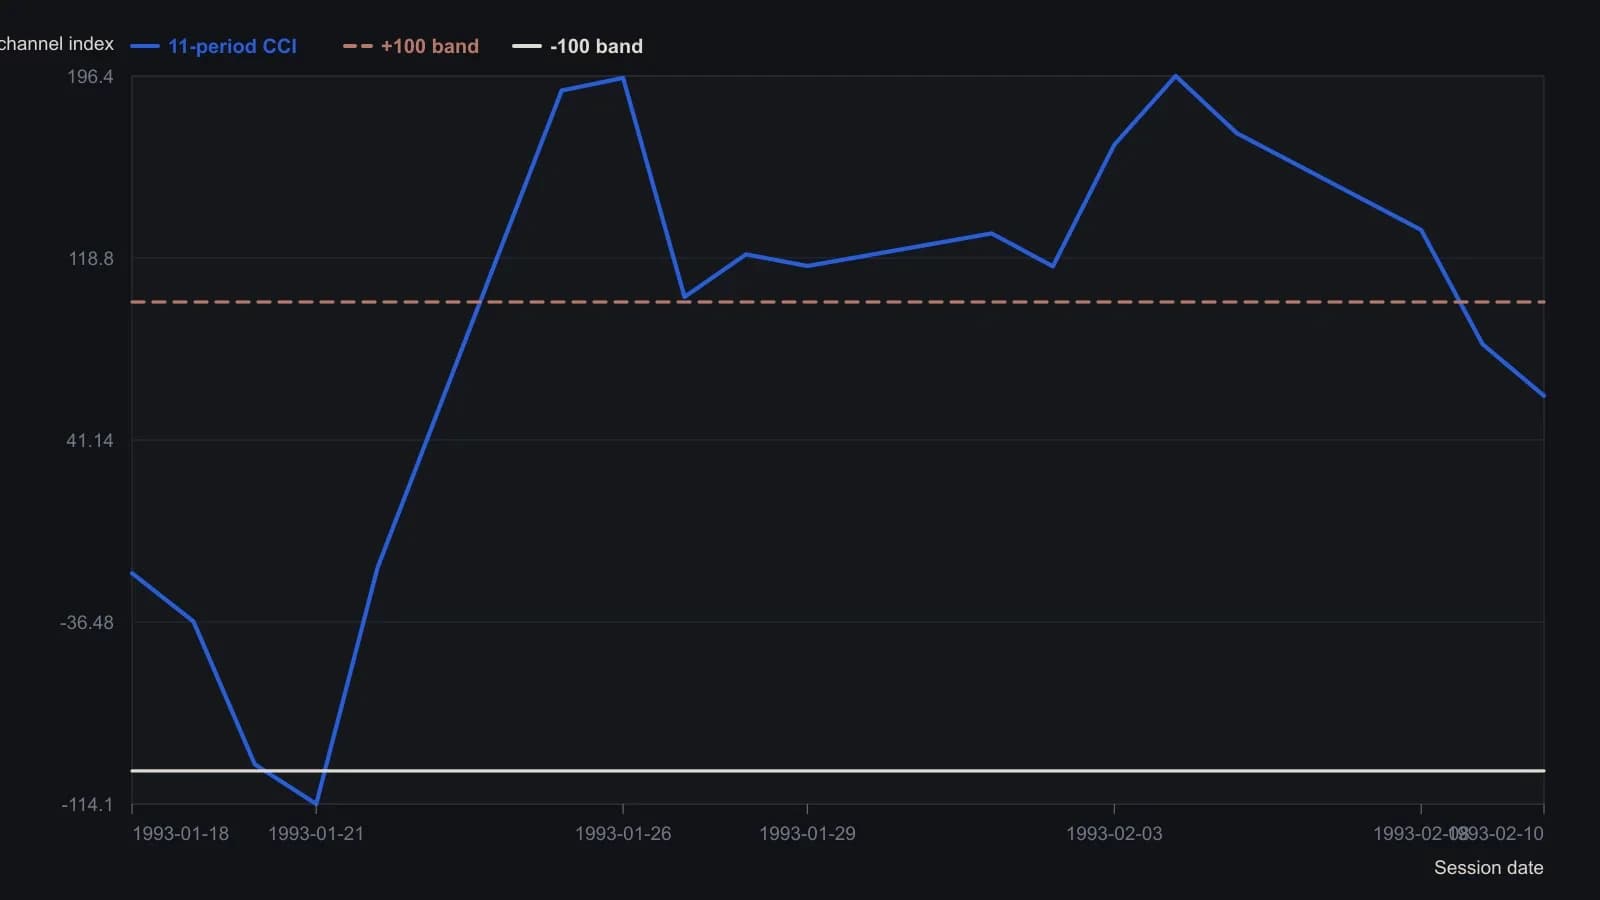
The printed example fixes an 11-session lookback and the 0.015 constant; the separate S&P 500 figure in the article uses a 20-period CCI and is not this series. The first CCI prints only on 18 January, after 11 typical prices. The date cell printed as 930304 sits between 3 February and 5 February and is plotted as 4 February 1993.
Lookback length is a free parameter
Lookback length is a free parameter. A shorter window is described as producing more false crossings. A longer window is described as omitting or delaying crossings.
A full window before the first scaled ratio
A worked 11-period spreadsheet example computes the moving average, mean deviation, and scaled ratio only after a full window of typical prices is available.
Start or end of a trend
The construction is framed as useful for marking the start or end of a trend and as less informative once a trend is already underway, at which point a separate trend-regime tool is required.
All readings on this track · 39 readings
- 1982Three gates on a 1982 pork-belly short
- 1982Scale-free Commodity Channel Index construction
- 1986Constructing a commodity channel index and a regression price channel
- 1987Constructing scaled OHLC matrices for study overlays
- 1987Constructing the commodity channel, average directional, and relative strength indexes on a shared cycle scale
- 1992Eleven-bar commodity channel index from typical price and mean deviation
- 1992Evaluating Commodity Channel Index breakout versus range rules
- 1992Evaluating breakout and CCI rules as complete mechanical procedures
- 1993Constructing stochastic, RSI and CCI inputs for forecasts
- 1993Nested centered channels with a commodity channel index confirmation gate
- 1993Listed-option timing as three separable clocks
- 1994Constructing an eleven-period commodity channel index
- 1994Confirming Elliott wave turns with channels and the commodity channel index
- 1995Commodity Channel Index band rules lag zero-line timing
- 1995Building the commodity channel index from typical price
- 1995Staged reversal rules with commodity channel index and average channels
- 1995Commodity channel index construction from typical price to a smoothed zero line
- 2001Reader tests for unfinished lookback oscillators
- 2002Constructing the commodity channel index from typical price
- 2003Breadth-filtered commodity channel index entry and exit rules
- 2003Constructing the Commodity Channel Index from typical price and scaled deviation
- 2003A shallow, poorly participated advance is an unconfirmed trend
- 2003CCI and RSI parameter defaults as scaling conventions
- 2003A cost and capital audit of a Commodity Channel Index trade engine
- 2003Commodity channel index peak divergence as an exit after twin patterns
- 2004Constructing the Commodity Channel Index from typical price
- 2004Constructing the Commodity Channel Index from typical price and mean deviation
- 2006Building custom indicators from the Commodity Channel Index, a least squares moving average and a rule-based entry
- 2012Confirming breakouts and retracements with CCI, ADX, and averages
- 2012Stacking oscillator lookbacks into a heatmap mosaic
- 2013Constructing a consensus and volatility-normalized value oscillator
- 2013Walk-forward system evaluation with a commodity channel index and chandelier exits
- 2014Dual detrended oscillators and dual Bollinger Band channels
- 2014RSI, CCI, and moving-average trend-filter construction
- 2014Dual RSI, a moving average, and CCI as a confirmation stack
- 2017Constructing dual-average cross and channel-index filters
- 2018Treat CAM as a classification layer before confirmation becomes an entry
- 2018Four-state slope labels gated by a moving average and a commodity channel index
- 2018Deviation-Scaled Moving Average construction from a two-bar difference