1995issue C041-8
Rolling correlation windows for shifting intermarket regimes
A story that one market moved because another market moved assumes a usable intermarket-linkage. The same pair can support or contradict that story depending on the window, so a rolling-correlation-window is read as a dated label beside a moving-average-trend-filter.
- Stories that one market moved because another market moved assume a usable intermarket-linkage, yet the same pair can support or contradict that story depending on the window.
- A rolling-correlation-window can swing a pair from nearly +1 to nearly -1 even when a longer sample shows only a moderate correlation-coefficient.
- Several short-window coefficients under one chart show when a chosen market is aligned with, inverse to, or nearly unlinked from each counterpart.
- Correlation overlays were a context layer for regime-aware-context, meant to sit beside a moving-average-trend-filter rather than serve as a complete method.
A linkage story is only as good as its window
Stories that one market moved because another market moved assume a usable intermarket-linkage. The same pair can support or contradict that story depending on the window.
Concurrent trends can still change sign
Daily Treasury bond futures compared with a dollar index, and separately with a utility-stock average, showed concurrent 1994 downtrends of lower highs and lower lows.
Weekly bond futures versus a broad commodity index looked like an inverse-relationship in 1993, then more aligned through much of 1994. Bonds then turned down while commodities leveled off late that year.
A long-sample score can hide a swing
Rescaling bonds and the dollar index to a common start of 100 from April 1992 showed alternating tandem and inverse episodes, so the pair was not locked in one sign. Over that longer sample the bond-dollar correlation-coefficient was +0.60 on a scale from -1 to +1, a positive but moderate reading next to values near +0.90.
A rolling-correlation-window of 30 trading days for the same pair swung from nearly +1 to nearly -1. Both the strength and the sign of the intermarket-linkage changed inside the longer window.
Several counterparts under one chart
Several 30-day correlation-coefficient readings under a bond or equity chart, versus the dollar, utilities, gold, a broad equity index, and a commodity index, show when a chosen market is aligned with, inverse to, or nearly unlinked from each counterpart.
In a late-1994 equity example, 30-day coefficients versus the dollar and bonds approached -0.80 while the index made new lows. After the index turned up, those coefficients rose as the three markets began to travel together.
Turns in the rolling-correlation-window were treated as more timely than waiting for extreme readings near plus or minus 0.90, because a high reading can persist after the linkage is already in place.
Read the label beside a trend filter
Correlation overlays were presented as a context layer to combine with a moving-average-trend-filter, not as a complete method on their own.
TradersWeek editorial: that two-layer habit keeps a single trade inside regime-aware-context, judged against whichever relationships are currently tight, inverted, or near zero.
Weekly T-bond futures versus the CRB index, 1991–1995
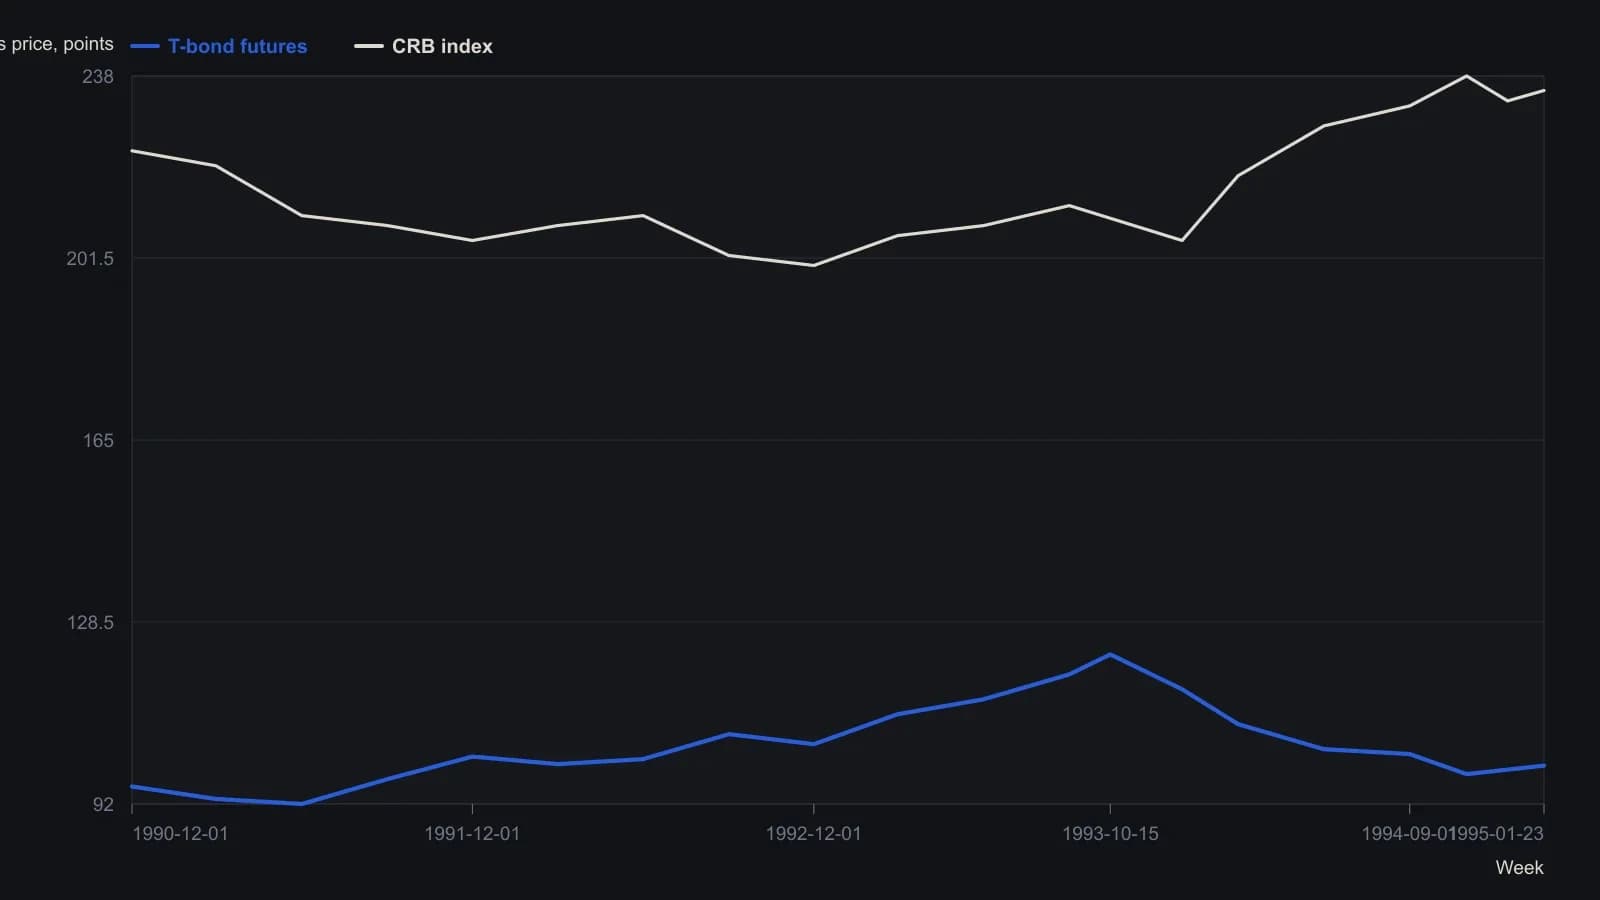
OHLC weekly bars digitized at month-end closes from the Technical Tools ChartBook raster; prices are approximate to the labeled ticks (bonds in points, CRB in index points).
All readings on this track · 37 readings
- 1988Constructing a lead-aware correlation coefficient
- 1989A precious-metal price as a changing intermarket equation
- 1990Two clocks for copper: a factor regime, a regression baseline, and leftover moving-average timing
- 1990Earnings yield, rate correlation and regression for equity value
- 1991Name the window, then combine leaders
- 1991Constructing a two-market linear correlation check
- 1991Constructing a commodity-bond correlation regime filter
- 1992Building intermarket context with linear correlation
- 1993Inverse-scale overlays as a gold-equity regime filter
- 1994Constructing seasonal slots from windows, analog years, and implied volatility
- 1995Pin one reference close and roll companion correlations as an overlay
- 1995Rolling correlation windows for shifting intermarket regimes
- 1998Gold as a cross-market regime barometer
- 1999The gold-bond inverse is a regime, not a cause
- 1999A nested lag test of gold leading bond yields
- 1999Constructing spreads from stock and intermarket correlation
- 2000Evaluating headline versus food-and-energy-excluded CPI as bond-yield context
- 2005A late EUR/USD fifth wave tested by the Bund-Treasury gap
- 2006Intermarket dislocation as context for short-horizon momentum
- 2008Map ordinary 12-month outcomes before stacking valuation, rates, and seasonality
- 2008A clean-energy theme inside the oil-and-energy regime
- 2014Quantitative-easing overlays as fragile belief regimes
- 2015Three intermarket checks from the late-2014 crude decline
- 2015Basket construction via rank, correlation, and locked rules
- 2015Construct a CAD-oil pair from percent-of-range Bollinger maps
- 2015CAD/USD and crude: first the correlation, then the band gap
- 2017Correlation regime versus moving-average crossover for S&P 500 exposure
- 2017Updating intermarket systems after correlation shifts
- 2017Constructing a correlation-divergence regime filter for yen and Nikkei context
- 2018Clustered negative troughs in an energy-index pairwise correlation
- 2018Filter pairwise-correlation before reading an intermarket regime
- 2018Moving-average supports in the March 2018 correlation shock
- 2020Bond spreads as an equity regime lens
- 2020Crash-protection folklore as a correlation regime question
- 2020Constructing a bounded correlation-trend-filter
- 2020Constructing a correlation-to-line trend filter
- 2020Bitcoin correlation regimes across equities and gold