1994issue C101-11
Constructing seasonal slots from windows, analog years, and implied volatility
A futures slot can be assembled from a historically recurring window, a correlated seasonal built from analog years, and a local implied-volatility regime. Seasonal analysis organizes that slot for a multi-market book. The trader still supplies entry, risk control, and style.
- Seasonal analysis can organize historically recurring windows rather than issue a forecast, so the trader still supplies entry, risk control, and style.
- A bull-year seasonal and a bear-year seasonal need an explicit regime definition before the same calendar window is reused.
- A correlated seasonal keeps only analog years that clear a pattern-correlation floor after the current contract is normalized over a fixed lookback.
- Implied volatility analysis belongs in the slot because an already elevated implied-volatility regime, or a later seasonal collapse in volatility, can undo a directionally correct options overlay.
Organize a window, not a forecast
Seasonal analysis can be framed as organizing historically recurring windows rather than issuing a forecast. The trader still supplies entry, risk control, and style.
In this TradersWeek editorial reading, construction means assembling one futures slot from three layers: a historically recurring window, an analog-year path match from correlation analysis, and the local implied-volatility regime. The finished object is then judged for a multi-market seasonal book rather than left standing as a forecast.
Define the historically recurring window
Splitting seasonal templates into a bull-year seasonal and a bear-year seasonal requires an explicit definition of those regimes before the same calendar window is used. Dated event windows, such as quarterly Treasury auctions that have often coincided with bond-trend turns, can serve as the start of a watch plan rather than an automatic order.
One publishing filter kept only same-direction moves that had recurred in the same period in at least 80 percent of the prior 15 years, and noted that shorter samples make perfect historical hit rates easier to obtain.
When approaching-date price action fails the usual seasonal setup, as with a typical spring coffee selloff that did not print lower highs, the divergence can flag a counterseasonal move instead of the historical path.
Build a correlated seasonal from analog years
A correlated seasonal is built by normalizing the current contract over a fixed lookback, ranking analog years above a minimum pattern correlation, and projecting a composite only from those years.
One August live-cattle study used a 243-day window across 29 years and a 60 percent correlation floor, then projected the post-window path from the four closest analog years.
August 1994 live cattle versus its four-year analog seasonal
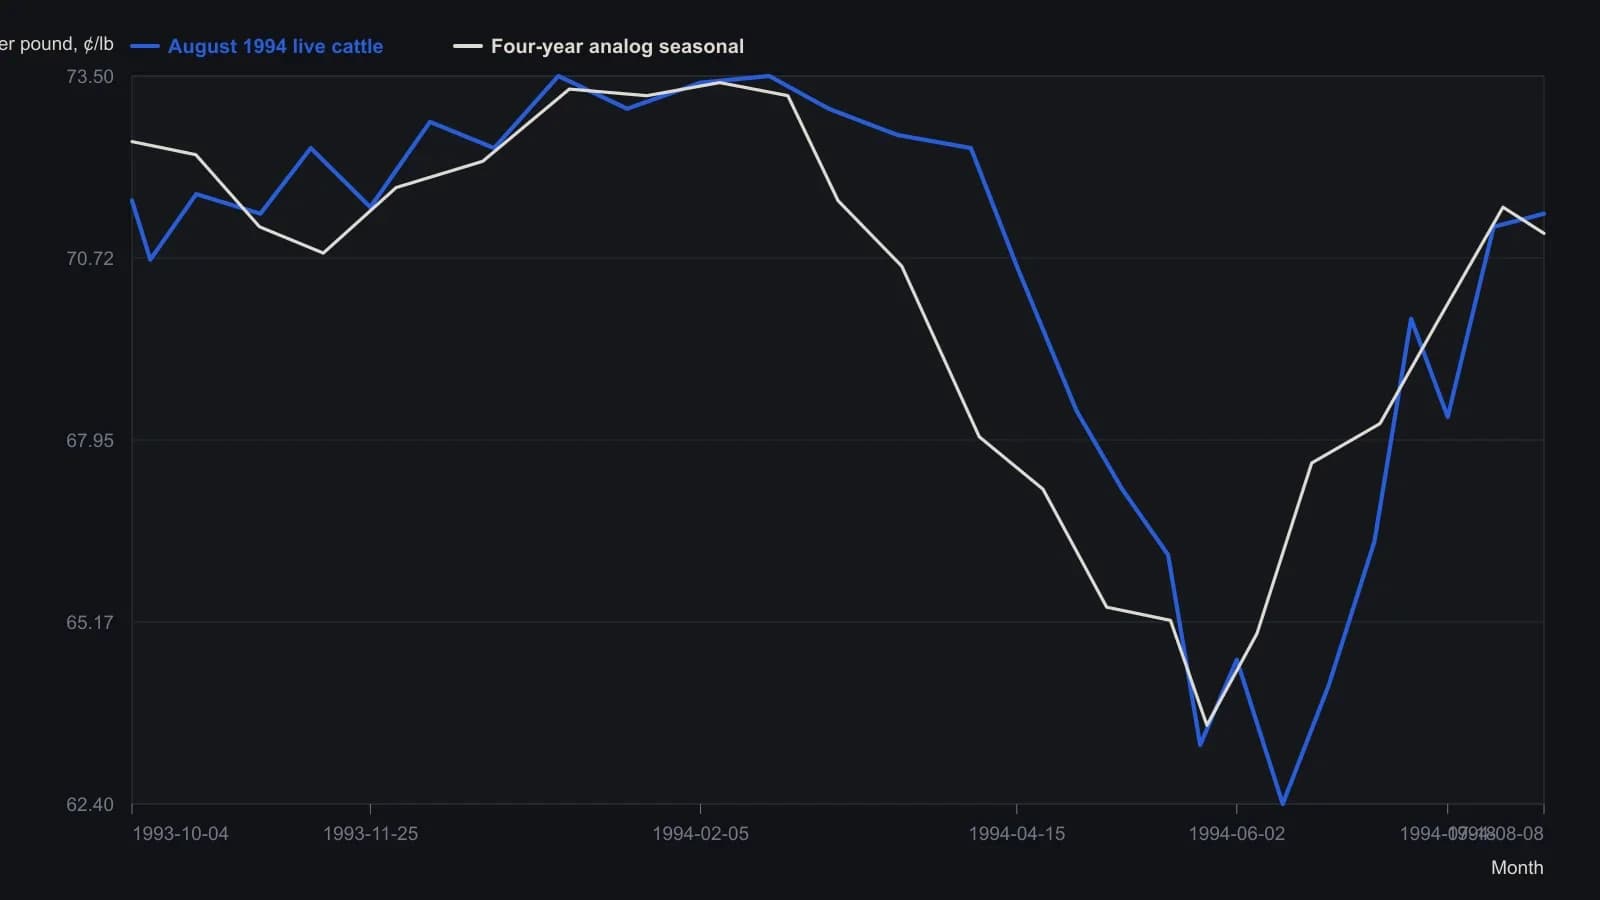
Moore required at least 60 percent pattern correlation and used only 1966 (86%), 1974 (85%), 1989 (76%) and 1986 (62%) over a 243-day window ending 1 June 1994. After that date the dotted line is a projection. Points are approximate readings from a magazine raster.
Attach the implied-volatility regime
Buying options when implied volatility is already elevated can lose even if direction is correct if that implied volatility later falls. Selling elevated volatility still loses if the underlying travels too far.
Treasury-bond and equity-index options were described as raising implied volatility when price fell, whereas grain options more often saw volatility rise with price and increase into summer. Implied volatility itself can be treated as seasonal: grain and live-cattle volatility was described as high in summer then collapsing, while Treasury-bond volatility was described as tending to peak in June.
Keep the slot in a book
In this TradersWeek editorial reading, the last construction step is not to treat the composite as a forecast. It is to decide whether the historically recurring window, the analog-year set from correlation analysis, and the implied-volatility regime still justify keeping the slot in a multi-market seasonal book.
A failed approaching-date setup can point to a counterseasonal move. Analog years that do not clear the pattern-correlation floor are left out of the composite. An already elevated implied-volatility regime can work against an options overlay even when direction is later correct.
All readings on this track · 37 readings
- 1988Constructing a lead-aware correlation coefficient
- 1989A precious-metal price as a changing intermarket equation
- 1990Two clocks for copper: a factor regime, a regression baseline, and leftover moving-average timing
- 1990Earnings yield, rate correlation and regression for equity value
- 1991Name the window, then combine leaders
- 1991Constructing a two-market linear correlation check
- 1991Constructing a commodity-bond correlation regime filter
- 1992Building intermarket context with linear correlation
- 1993Inverse-scale overlays as a gold-equity regime filter
- 1994Constructing seasonal slots from windows, analog years, and implied volatility
- 1995Pin one reference close and roll companion correlations as an overlay
- 1995Rolling correlation windows for shifting intermarket regimes
- 1998Gold as a cross-market regime barometer
- 1999The gold-bond inverse is a regime, not a cause
- 1999A nested lag test of gold leading bond yields
- 1999Constructing spreads from stock and intermarket correlation
- 2000Evaluating headline versus food-and-energy-excluded CPI as bond-yield context
- 2005A late EUR/USD fifth wave tested by the Bund-Treasury gap
- 2006Intermarket dislocation as context for short-horizon momentum
- 2008Map ordinary 12-month outcomes before stacking valuation, rates, and seasonality
- 2008A clean-energy theme inside the oil-and-energy regime
- 2014Quantitative-easing overlays as fragile belief regimes
- 2015Three intermarket checks from the late-2014 crude decline
- 2015Basket construction via rank, correlation, and locked rules
- 2015Construct a CAD-oil pair from percent-of-range Bollinger maps
- 2015CAD/USD and crude: first the correlation, then the band gap
- 2017Correlation regime versus moving-average crossover for S&P 500 exposure
- 2017Updating intermarket systems after correlation shifts
- 2017Constructing a correlation-divergence regime filter for yen and Nikkei context
- 2018Clustered negative troughs in an energy-index pairwise correlation
- 2018Filter pairwise-correlation before reading an intermarket regime
- 2018Moving-average supports in the March 2018 correlation shock
- 2020Bond spreads as an equity regime lens
- 2020Crash-protection folklore as a correlation regime question
- 2020Constructing a bounded correlation-trend-filter
- 2020Constructing a correlation-to-line trend filter
- 2020Bitcoin correlation regimes across equities and gold