2020issue C018-15
Bond spreads as an equity regime lens
A broad US equity ETF can be treated as a function of a daily growth term and high-yield-minus-Treasury spreads. Editorial note: TradersWeek then reads the reduced residual as a weekly regime overlay, not as another equity-only oscillator.
- A broad US equity ETF is a market-wide proxy, so credit and Treasury markets can supply an independent valuation window.
- A usable equity-level model needs a growth factor, a defined equity risk premium, an inflation measure, and both stock and bond valuations.
- Backward elimination and correlation analysis drop overlapping credit-Treasury spread terms until each remaining predictor stays statistically useful.
- Editorial: TradersWeek treats the residual of that cross-asset fit as a weekly regime overlay, not as a standalone equity oscillator.
An outside window on a broad equity ETF
A broad US equity ETF can be treated as a market-wide proxy whose level depends on many macro and sentiment drivers. An outside asset class can therefore supply an independent valuation window.
Intermarket analysis uses another asset class, especially credit and Treasury markets, as that independent window on equity valuation and regime. The credit market is framed as a complementary gauge of what bonds are saying about equities. The source workflow cited a US bond market that was more than double nominal GDP.
What a usable equity-level model needs
A usable equity-level model is described as needing a growth factor, a defined equity risk premium, an inflation measure, and both stock and bond valuations. The equity risk premium is the extra expected return demanded for holding equities instead of a safer government bond.
A simple earnings-yield versus 10-year yield comparison, often called the Fed model, treats stocks and bonds as competing income assets. That comparison is presented as breaking down when inflation and rates are low. It also faces a high-growth case that can produce an unusable negative price.
Growth plus three credit-Treasury spreads
The proposed specification treats the equity ETF price as a function of a daily growth term plus high-yield-minus-Treasury spreads across short, intermediate, and long government maturities.
Each credit-Treasury spread is the price gap between a high-yield corporate bond fund and a Treasury fund of a chosen maturity, used as a predictor of broad equity level. Linear regression then fits the equity price to that small set of bond-spread and growth predictors.
SPY versus the three-spread credit model, 2013–2019
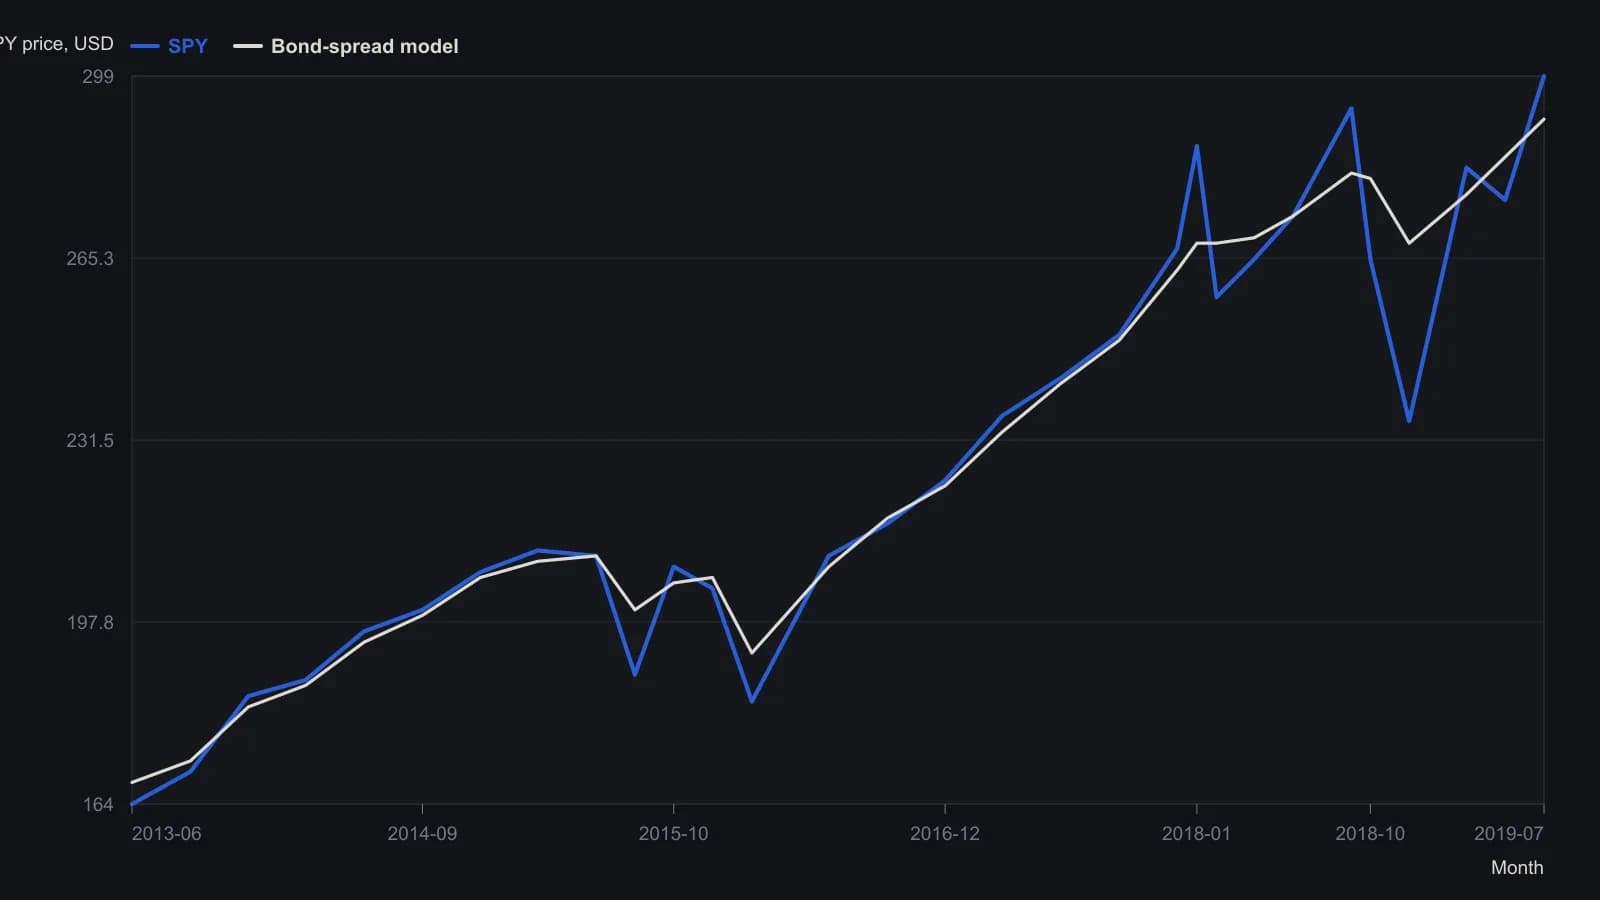
The source dropped the intermediate-maturity spreads after backward elimination, fitted through the origin by treating the 12 April 2007 SPY print as zero, then added back 144.66 dollars to plot levels. In-sample R-squared was 0.991 with a 6.671 dollar standard error. Circled regions mark multi-week residual stretches.
Drop overlapping predictors
Backward elimination starts with all candidate predictors, drops the term with the smallest absolute t-statistic, and repeats until every remaining predictor is statistically significant. The loop is meant to leave a set that is significant and less collinear.
Correlation analysis measures how closely credit-Treasury spread pairs move together so redundant predictors can be removed from a joint market model. On the out-of-sample fit, overlapping information appeared as a very high negative correlation between two intermediate and long credit-Treasury spreads and a similarly high negative correlation between another pair. The common weaker term was removed.
Fit through a chosen starting price
The regressions were run through the origin by setting the equity ETF price on the first sample day to zero, then recovering the plotted level by adding back that first-day price. Through the origin is a regression constraint that forces the fitted series through a chosen starting price so later levels can be recovered in the same way.
Editorial reading of the residual
Editorial: once the reduced fit is in hand, TradersWeek reads large, persistent gaps between the ETF and the credit-plus-growth level as a weekly regime overlay. Those residual bands are cross-asset context for the broader tape, not another equity-only oscillator.
All readings on this track · 37 readings
- 1988Constructing a lead-aware correlation coefficient
- 1989A precious-metal price as a changing intermarket equation
- 1990Two clocks for copper: a factor regime, a regression baseline, and leftover moving-average timing
- 1990Earnings yield, rate correlation and regression for equity value
- 1991Name the window, then combine leaders
- 1991Constructing a two-market linear correlation check
- 1991Constructing a commodity-bond correlation regime filter
- 1992Building intermarket context with linear correlation
- 1993Inverse-scale overlays as a gold-equity regime filter
- 1994Constructing seasonal slots from windows, analog years, and implied volatility
- 1995Pin one reference close and roll companion correlations as an overlay
- 1995Rolling correlation windows for shifting intermarket regimes
- 1998Gold as a cross-market regime barometer
- 1999The gold-bond inverse is a regime, not a cause
- 1999A nested lag test of gold leading bond yields
- 1999Constructing spreads from stock and intermarket correlation
- 2000Evaluating headline versus food-and-energy-excluded CPI as bond-yield context
- 2005A late EUR/USD fifth wave tested by the Bund-Treasury gap
- 2006Intermarket dislocation as context for short-horizon momentum
- 2008Map ordinary 12-month outcomes before stacking valuation, rates, and seasonality
- 2008A clean-energy theme inside the oil-and-energy regime
- 2014Quantitative-easing overlays as fragile belief regimes
- 2015Three intermarket checks from the late-2014 crude decline
- 2015Basket construction via rank, correlation, and locked rules
- 2015Construct a CAD-oil pair from percent-of-range Bollinger maps
- 2015CAD/USD and crude: first the correlation, then the band gap
- 2017Correlation regime versus moving-average crossover for S&P 500 exposure
- 2017Updating intermarket systems after correlation shifts
- 2017Constructing a correlation-divergence regime filter for yen and Nikkei context
- 2018Clustered negative troughs in an energy-index pairwise correlation
- 2018Filter pairwise-correlation before reading an intermarket regime
- 2018Moving-average supports in the March 2018 correlation shock
- 2020Bond spreads as an equity regime lens
- 2020Crash-protection folklore as a correlation regime question
- 2020Constructing a bounded correlation-trend-filter
- 2020Constructing a correlation-to-line trend filter
- 2020Bitcoin correlation regimes across equities and gold