1999issue C071-7
Constructing spreads from stock and intermarket correlation
Spread construction is a sequencing problem: measure the sign and reset horizon of each link, treat a news print as a clock rather than a trade ticket, then pair same-sign and opposite-sign legs. Editorial: the finished book should encode a cross-market regime, not a single-name headline.
- A correlation coefficient is a signed index of linear association between two series, ranging from minus one to plus one.
- Coefficients are not fixed: individual-security links often reset weekly to monthly, sector links monthly to yearly, and commodity links over years to decades.
- A news-driven spike can serve as an alert for a later secondary move rather than a coin-flip chase of the name already in play.
- A two-leg book can pair a long in a positively related partner with a short in a negatively related partner of the news name.
Start with the sequence
Spread construction is a sequencing problem. Measure the sign of each link and the correlation horizon on which that sign remains useful. Then treat a news print as a clock rather than a trade ticket. Only after those two readings should the legs be assembled.
Editorial: TradersWeek treats the finished book as a way to encode a cross-market regime, not as a ticket on a single-name headline.
Measure the sign of each link
A correlation coefficient is a signed index of linear association between two series and ranges from minus one to plus one. Positive correlation is a same-direction relationship, strongest when the coefficient is near plus one. Negative correlation is an opposite-direction relationship, strongest when the coefficient is near minus one. Zero correlation is a measured linear relationship near zero, in which one series can move while the other does not.
Under a coefficient of plus one, a one-point rise in the first series is matched one-for-one. At plus 0.5 the matching move is half a point. At zero the second series need not move.
The same measurement nests from single names to industry groups, broad averages, and, to a varying degree, global markets. Same-industry names typically show the tightest links.
Measure the correlation horizon
Coefficients are not fixed. Individual-security links often reset on a weekly-to-monthly horizon, sector links on a monthly-to-yearly horizon, and commodity links over years to decades. Sector rotation is a weeks-to-months process rather than an intradaily event.
A rolling coefficient can be computed from a 30-day lookback window of closes, measuring each comparison market against a fixed reference series such as Treasury bond futures.
Finance and DJ Utilities, September–October 1994
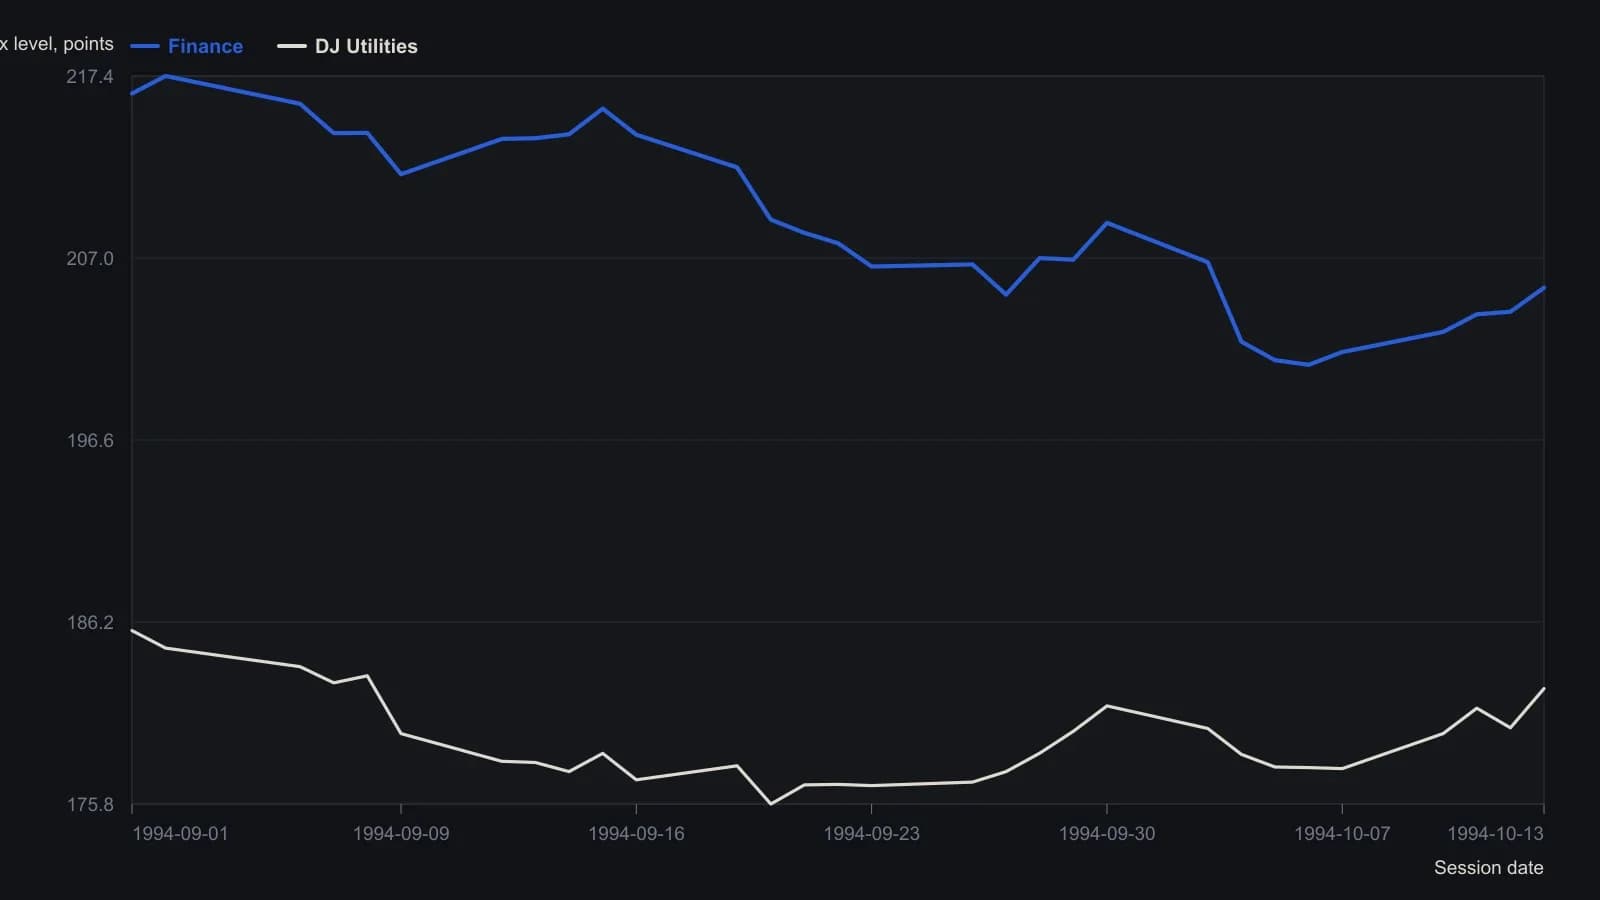
The same sheet prints trailing correlations versus the T-bond column of 0.9117 for Finance and 0.66 for DJU; those are summary cells, not a plotted series.
Treat a news print as a clock
Because related names react on different clocks, a news-driven spike in one issue can serve as an alert for later secondary moves rather than a coin-flip chase of the name already in play.
That delay is the forecasting effect: the gap between a news-driven move in one security and later related moves in linked securities.
Assemble same-sign and opposite-sign legs
A two-leg book can be assembled from mixed signs: a long in a positively related partner and a short in a negatively related partner of the news name. Spread construction builds that book so a news event is expressed as a relationship.
One path that can sit behind those signs is the intermarket chain. A prolonged oil-price rise can be linked through inflation fears and policy-rate responses to a decline in bond prices.
Editorial: TradersWeek reads the completed two-leg book as a market-regime statement. A single-name position left without a related offset is more exposed to systemic risk, the chance that a conflicting move in the broader market pulls the position against its intended direction.
All readings on this track · 37 readings
- 1988Constructing a lead-aware correlation coefficient
- 1989A precious-metal price as a changing intermarket equation
- 1990Two clocks for copper: a factor regime, a regression baseline, and leftover moving-average timing
- 1990Earnings yield, rate correlation and regression for equity value
- 1991Name the window, then combine leaders
- 1991Constructing a two-market linear correlation check
- 1991Constructing a commodity-bond correlation regime filter
- 1992Building intermarket context with linear correlation
- 1993Inverse-scale overlays as a gold-equity regime filter
- 1994Constructing seasonal slots from windows, analog years, and implied volatility
- 1995Pin one reference close and roll companion correlations as an overlay
- 1995Rolling correlation windows for shifting intermarket regimes
- 1998Gold as a cross-market regime barometer
- 1999The gold-bond inverse is a regime, not a cause
- 1999A nested lag test of gold leading bond yields
- 1999Constructing spreads from stock and intermarket correlation
- 2000Evaluating headline versus food-and-energy-excluded CPI as bond-yield context
- 2005A late EUR/USD fifth wave tested by the Bund-Treasury gap
- 2006Intermarket dislocation as context for short-horizon momentum
- 2008Map ordinary 12-month outcomes before stacking valuation, rates, and seasonality
- 2008A clean-energy theme inside the oil-and-energy regime
- 2014Quantitative-easing overlays as fragile belief regimes
- 2015Three intermarket checks from the late-2014 crude decline
- 2015Basket construction via rank, correlation, and locked rules
- 2015Construct a CAD-oil pair from percent-of-range Bollinger maps
- 2015CAD/USD and crude: first the correlation, then the band gap
- 2017Correlation regime versus moving-average crossover for S&P 500 exposure
- 2017Updating intermarket systems after correlation shifts
- 2017Constructing a correlation-divergence regime filter for yen and Nikkei context
- 2018Clustered negative troughs in an energy-index pairwise correlation
- 2018Filter pairwise-correlation before reading an intermarket regime
- 2018Moving-average supports in the March 2018 correlation shock
- 2020Bond spreads as an equity regime lens
- 2020Crash-protection folklore as a correlation regime question
- 2020Constructing a bounded correlation-trend-filter
- 2020Constructing a correlation-to-line trend filter
- 2020Bitcoin correlation regimes across equities and gold