2000issue C111-4
Evaluating headline versus food-and-energy-excluded CPI as bond-yield context
A historical two-pass comparison scored the 30-year yield against headline CPI and food-and-energy-excluded CPI, first in rolling two-year windows and then only inside moving-average-channel yield-trend segments.
- A correlation coefficient ranges from -1.0 to +1.0 and records both the direction and the strength of association between two time series.
- Fifteen rolling two-year windows on monthly data produced average coefficients of +0.50 for the 30-year yield versus headline CPI and +0.31 versus food-and-energy-excluded CPI, with the headline pairing larger in 10 of the 15 windows.
- Across 14 moving-average-channel yield-trend segments, yield change shared direction with headline CPI in 10 cases and with food-and-energy-excluded CPI in 7, and the segment correlations were +0.79 and +0.53.
- Editorial: re-score the context series only inside channel-defined yield trends so the comparison is made where a multi-week yield regime actually lives.
Two inflation series as yield context
A long-bond yield move can be placed in intermarket context by pairing it with a consumer inflation series. Two candidates compete: headline CPI, the all-items consumer inflation rate measured here as the change over the prior twelve months, and food-and-energy-excluded CPI, the consumer inflation rate that omits food and energy prices and is often treated as a smoother alternative to the all-items series.
The historical workflow compared each series with the 30-year yield. It did not treat the smoother series as automatically the better backdrop.
First pass: rolling co-movement
A correlation coefficient is a signed association statistic between two series. It runs from -1.0 to +1.0, and zero implies no linear relationship. It records both the direction and the strength of association.
Monthly data covering 16 years were examined in overlapping two-year windows advanced one year at a time. That rolling two-year window design produced 15 coefficients for each pairing of the 30-year yield with an inflation series. Successive windows overlap, so the 15 coefficients can be averaged.
Across those 15 windows the average coefficient was +0.50 for yield versus headline CPI and +0.31 for yield versus food-and-energy-excluded CPI. The yield versus headline CPI coefficient exceeded the yield versus food-and-energy-excluded coefficient in 10 of the 15 windows.
Rolling two-year correlation of the 30-year yield with headline CPI and with food-and-energy-excluded CPI
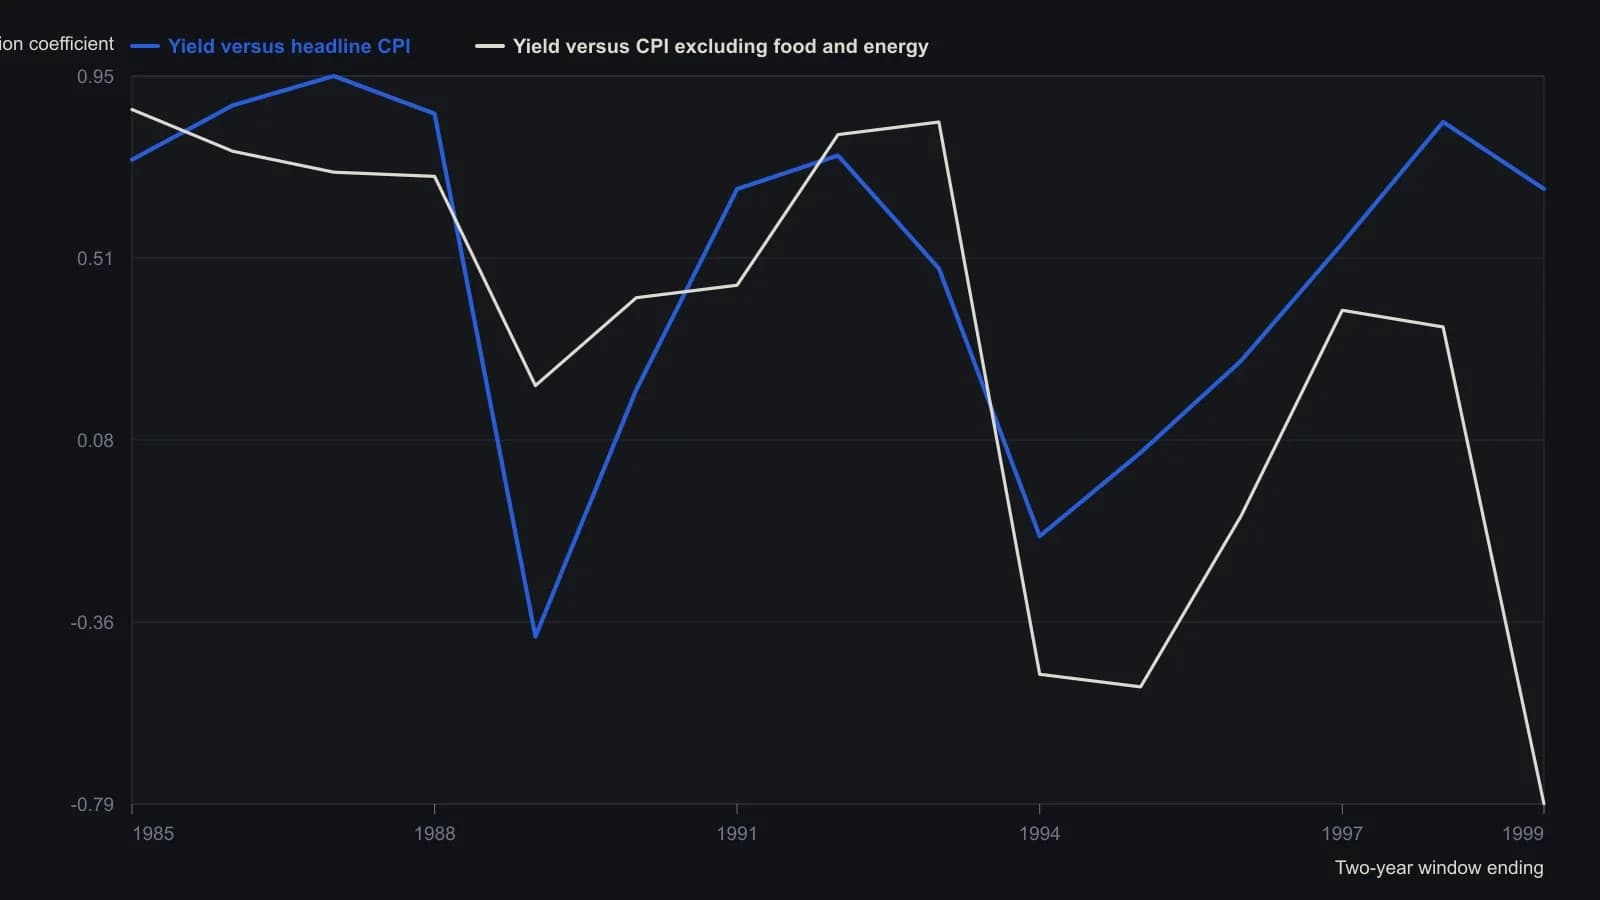
Each coefficient uses a two-year window advanced one year at a time, so neighboring windows share 12 months. Sixteen years of monthly observations produce 15 coefficients.
Second pass: channel-defined yield trends
A moving-average channel was then used to restrict the comparison to lengthy yield trends. The channel was a band around a 10-month average of yield, with the bands set at 2.5 percent of that average above and below it. Crossing the channel left behind a reactionary turn: the prior high or low used as the start or end of a trend segment.
A yield-trend segment is a lengthy up-move from a reactionary low to a reactionary high, or a down-move from a high to a low. The channel marked reactionary yield highs and lows and isolated those lengthy trends.
Across 14 channel-defined yield trends, yield change and headline CPI change shared direction in 10 cases, versus 7 cases for the food-and-energy-excluded series. Over those 14 trend segments the correlation of yield change with headline CPI change was +0.79, versus +0.53 with food-and-energy-excluded CPI.
One uptrend as a check
In the March 1986 to September 1987 yield uptrend, yield rose 2.33 while headline CPI rose 2.21 and food-and-energy-excluded CPI rose 0.12.
Editorial: the first pass answers which series co-moves more often in overlapping two-year samples. The second pass asks whether that comparison still holds when the sample is only the yield-trend segments that the channel isolates. On both passes the historical coefficients were larger for headline CPI. The March 1986 to September 1987 uptrend is one case in which yield and headline CPI rose together while food-and-energy-excluded CPI rose 0.12. This is a historical comparison of context series, not a claim about present-day yields.
All readings on this track · 37 readings
- 1988Constructing a lead-aware correlation coefficient
- 1989A precious-metal price as a changing intermarket equation
- 1990Two clocks for copper: a factor regime, a regression baseline, and leftover moving-average timing
- 1990Earnings yield, rate correlation and regression for equity value
- 1991Name the window, then combine leaders
- 1991Constructing a two-market linear correlation check
- 1991Constructing a commodity-bond correlation regime filter
- 1992Building intermarket context with linear correlation
- 1993Inverse-scale overlays as a gold-equity regime filter
- 1994Constructing seasonal slots from windows, analog years, and implied volatility
- 1995Pin one reference close and roll companion correlations as an overlay
- 1995Rolling correlation windows for shifting intermarket regimes
- 1998Gold as a cross-market regime barometer
- 1999The gold-bond inverse is a regime, not a cause
- 1999A nested lag test of gold leading bond yields
- 1999Constructing spreads from stock and intermarket correlation
- 2000Evaluating headline versus food-and-energy-excluded CPI as bond-yield context
- 2005A late EUR/USD fifth wave tested by the Bund-Treasury gap
- 2006Intermarket dislocation as context for short-horizon momentum
- 2008Map ordinary 12-month outcomes before stacking valuation, rates, and seasonality
- 2008A clean-energy theme inside the oil-and-energy regime
- 2014Quantitative-easing overlays as fragile belief regimes
- 2015Three intermarket checks from the late-2014 crude decline
- 2015Basket construction via rank, correlation, and locked rules
- 2015Construct a CAD-oil pair from percent-of-range Bollinger maps
- 2015CAD/USD and crude: first the correlation, then the band gap
- 2017Correlation regime versus moving-average crossover for S&P 500 exposure
- 2017Updating intermarket systems after correlation shifts
- 2017Constructing a correlation-divergence regime filter for yen and Nikkei context
- 2018Clustered negative troughs in an energy-index pairwise correlation
- 2018Filter pairwise-correlation before reading an intermarket regime
- 2018Moving-average supports in the March 2018 correlation shock
- 2020Bond spreads as an equity regime lens
- 2020Crash-protection folklore as a correlation regime question
- 2020Constructing a bounded correlation-trend-filter
- 2020Constructing a correlation-to-line trend filter
- 2020Bitcoin correlation regimes across equities and gold