1999issue C021-4
The gold-bond inverse is a regime, not a cause
From 1984 through 1998, gold and the Treasury-bond future moved in opposite directions in 43 of 63 adjacent windows where gold changed more than $20. That opposite-direction count describes a market regime. Editorial reading: do not promote the score into a cause, because a monthly inflation print leaves most working days without the third series.
- Correlation analysis on this pair is a same-way versus opposite-way tally of significant gold moves, not a proof that one market moved the other.
- Intermarket analysis can place a gold or bond position inside a multi-week market regime without turning that opposite-direction count into a cause.
- A once-a-month inflation print leaves about 20 of 21 working days showing only gold and the bond, so the shared inflation driver is usually missing.
- An isolated 50% gold decline would not, by itself, raise a fixed-income holder's purchasing power or force bond yields lower.
A two-step classroom drill
Editorial classroom note: work this pair in two steps. First, use correlation analysis to score whether significant gold moves still oppose the Treasury-bond future. Second, refuse to promote that opposite-direction count into a cause.
The archive supplies the first step as a historical count of adjacent periods. The second step is editorial. The lesson is the missing daily inflation series.
How adjacent periods were scored
A significant gold move was defined arbitrarily as a close more than $20 above or below a window's starting price. After that close, the next adjacent period began on that end date and ran until gold again closed more than $20 from that start. The paired Treasury-bond change was recorded in each window.
From 1984 through 1998, daily gold and Treasury-bond closes produced 63 adjacent windows in which gold moved more than $20.
What the opposite-direction count showed
In 43 of those 63 windows, or 68%, gold and the Treasury-bond future moved in opposite directions. Only 20 of the 63 windows showed a more-than-$20 gold change with the Treasury-bond future moving the same way, more than a 2-to-1 opposite-versus-same split.
Correlation analysis is that same-way versus opposite-way tally. Intermarket analysis then reads one position against the broader market regime those paired moves describe. A market regime is a multi-week stretch defined by how related prices tend to travel together, not by a single day's print.
Gold change in each adjacent $20-plus window
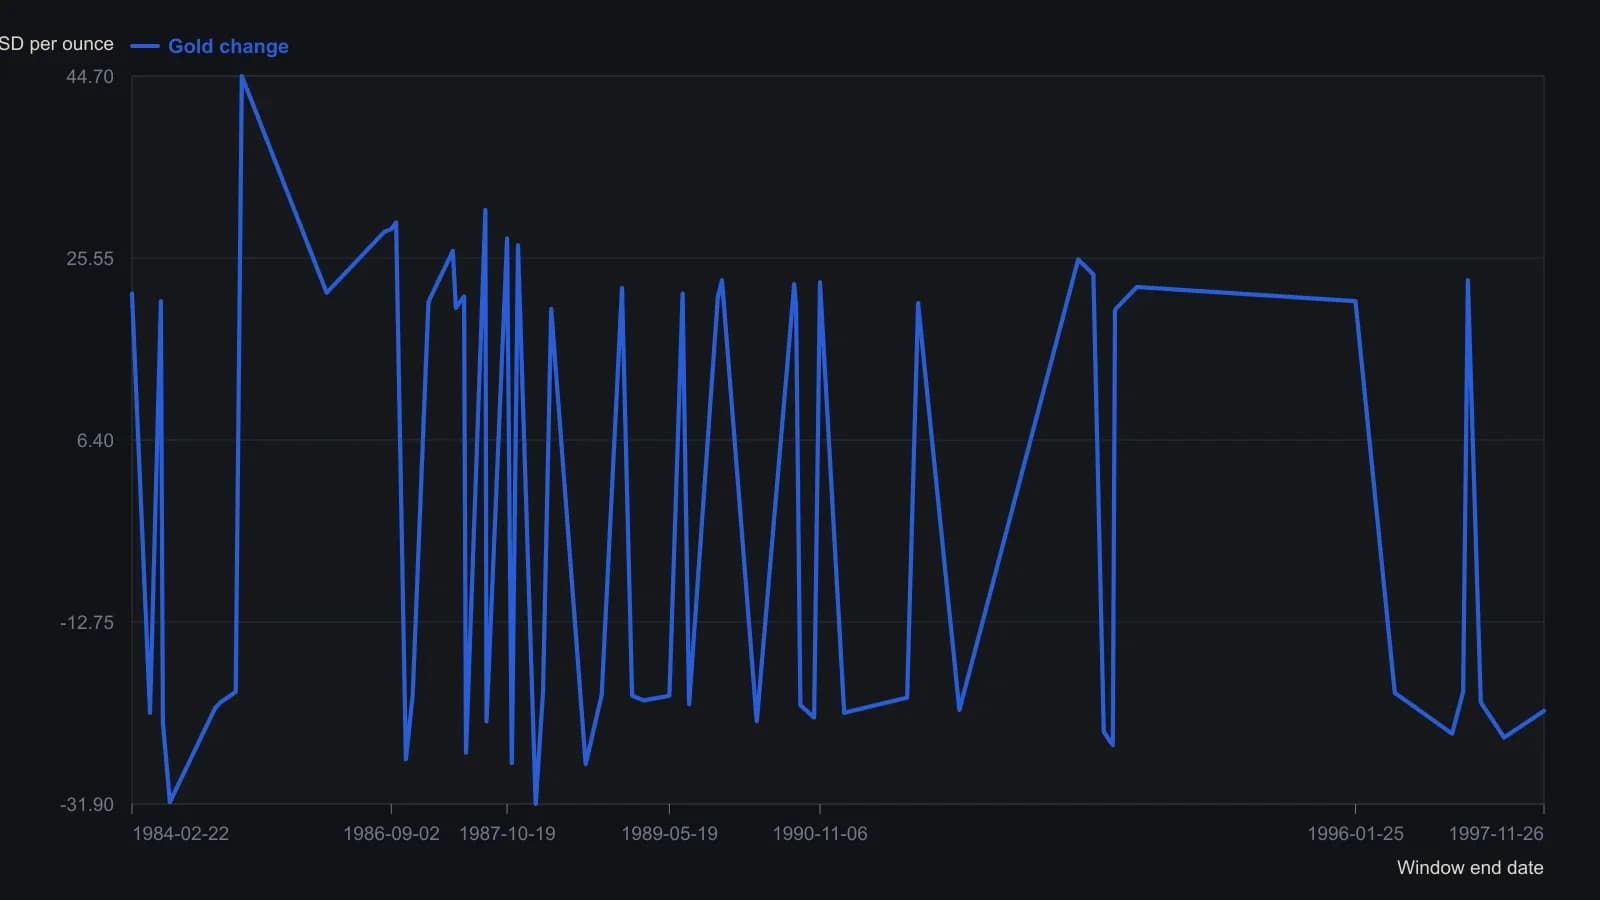
A significant gold move was defined in the source as more than $20 from the window start, using daily closes. Bond ticks from the same table are omitted because they are in futures points and 32nds, not dollars per ounce.
Same-way cases sit inside the sample
The first window ran from 3 January 1984, with gold at $381.70, to 22 February 1984 at $403.50: gold rose $21.80 over 36 days while the Treasury-bond future fell 10 ticks.
The next window, 22 February 1984 to 26 April 1984, showed gold falling $22.30 over 46 days while the Treasury-bond future also fell 3-06, a same-direction case inside the sample.
A 1989 weekly comparison showed an inverse gold-versus-bond pattern, while a 1990 daily comparison showed stretches in which the two markets moved the same way. Editorial reading: the inverse pairing was the more common regime, not the only one.
The missing daily inflation series
Conventional commentary treated a large gold rise as an inflation scare that should weigh on bonds, and a large gold decline as cooler inflation that should lift bonds.
Gold and the Treasury-bond future can be read as two response series to inflation, so a once-a-month inflation print leaves about 20 of 21 working days showing only two of the three variables. That third series is the shared inflation driver. It can move gold and bond yields at the same time without either market causing the other.
An isolated 50% gold decline would not, by itself, raise a fixed-income holder's purchasing power or force bond yields lower.
All readings on this track · 37 readings
- 1988Constructing a lead-aware correlation coefficient
- 1989A precious-metal price as a changing intermarket equation
- 1990Two clocks for copper: a factor regime, a regression baseline, and leftover moving-average timing
- 1990Earnings yield, rate correlation and regression for equity value
- 1991Name the window, then combine leaders
- 1991Constructing a two-market linear correlation check
- 1991Constructing a commodity-bond correlation regime filter
- 1992Building intermarket context with linear correlation
- 1993Inverse-scale overlays as a gold-equity regime filter
- 1994Constructing seasonal slots from windows, analog years, and implied volatility
- 1995Pin one reference close and roll companion correlations as an overlay
- 1995Rolling correlation windows for shifting intermarket regimes
- 1998Gold as a cross-market regime barometer
- 1999The gold-bond inverse is a regime, not a cause
- 1999A nested lag test of gold leading bond yields
- 1999Constructing spreads from stock and intermarket correlation
- 2000Evaluating headline versus food-and-energy-excluded CPI as bond-yield context
- 2005A late EUR/USD fifth wave tested by the Bund-Treasury gap
- 2006Intermarket dislocation as context for short-horizon momentum
- 2008Map ordinary 12-month outcomes before stacking valuation, rates, and seasonality
- 2008A clean-energy theme inside the oil-and-energy regime
- 2014Quantitative-easing overlays as fragile belief regimes
- 2015Three intermarket checks from the late-2014 crude decline
- 2015Basket construction via rank, correlation, and locked rules
- 2015Construct a CAD-oil pair from percent-of-range Bollinger maps
- 2015CAD/USD and crude: first the correlation, then the band gap
- 2017Correlation regime versus moving-average crossover for S&P 500 exposure
- 2017Updating intermarket systems after correlation shifts
- 2017Constructing a correlation-divergence regime filter for yen and Nikkei context
- 2018Clustered negative troughs in an energy-index pairwise correlation
- 2018Filter pairwise-correlation before reading an intermarket regime
- 2018Moving-average supports in the March 2018 correlation shock
- 2020Bond spreads as an equity regime lens
- 2020Crash-protection folklore as a correlation regime question
- 2020Constructing a bounded correlation-trend-filter
- 2020Constructing a correlation-to-line trend filter
- 2020Bitcoin correlation regimes across equities and gold