1992issue C121-5
Real bond yields as a deficit-share regime
Inflation is often treated as the primary map for long-term yields, yet multi-decade U.S. history includes long stretches when yields and inflation moved far apart. This archive article tests activity and then a public-borrowing share as competing maps so one bond idea is read as a months-ahead regime, not as an inflation-only chart.
- Inflation is often treated as the primary force behind long-term yields, yet multi-decade U.S. history includes long stretches when yields and inflation moved far apart.
- An activity-lead-lag test of year-over-year industrial production delayed by six months lined up poorly with real Treasury yields; the closest activity link ran the other way, with real-yield increases tending to precede economic upturns by about six months.
- Real bond rates showed a clearer historical pairing with the deficit-to-gdp-ratio than with inflation or activity alone, and a rise in that ratio has historically been followed by higher real bond rates.
- A forward-shifted-deficit, advancing the deficit-to-gdp-ratio by 10 months, improved the alignment of real-yield variations, and a then-recent rise in real rates was tied to an increase in the ratio that began in mid-1989.
Start with inflation, then measure what is left
Inflation is often treated as the primary force behind long-term yields, yet multi-decade U.S. history includes long stretches when yields and inflation moved far apart. A real-yield is the nominal long-term yield minus inflation, used to isolate rate pressure that a price-level series alone cannot explain.
Highest-grade U.S. bond real yields averaged 0.81% from 1914 through 1982 and 1.05% from 1950 through 1982, then averaged 5.5% from 1983 onward. A decade-scale comparison showed Treasury yields remaining high while measured inflation stayed low.
Test activity before you keep it
Year-over-year industrial production delayed by six months lined up poorly with real Treasury yields across roughly the prior two decades. The closest observed activity link ran the other way: real-yield increases tended to precede economic upturns by about six months.
Editorial: an activity-lead-lag check is a competing-explanation step on a single rate market. If the delayed production series does not map the real-yield path, activity is not the standalone regime for that bond idea.
Place the leftover path on public borrowing
Real bond rates compared with combined state and federal deficits as a percent of GDP showed a clearer historical pairing than inflation or activity alone. That comparison is the deficit-to-gdp-ratio overlay: combined government borrowing expressed as a share of domestic output and set next to real long-term yields.
A rise in the deficit-to-gdp-ratio has historically been followed by higher real bond rates, and a decline in the ratio has preceded a real-yield reversal.
A forward-shifted-deficit is the same borrowing-share series advanced by a fixed number of months to check whether turning points line up with later real-yield changes. Advancing the deficit-to-gdp-ratio by 10 months improved the alignment of real-yield variations, and to a lesser extent their levels.
A then-recent rise in real rates was tied to an increase in the deficit-to-gdp-ratio that began in mid-1989.
Real Treasury yields versus the deficit-to-GDP share, deficit advanced 10 months
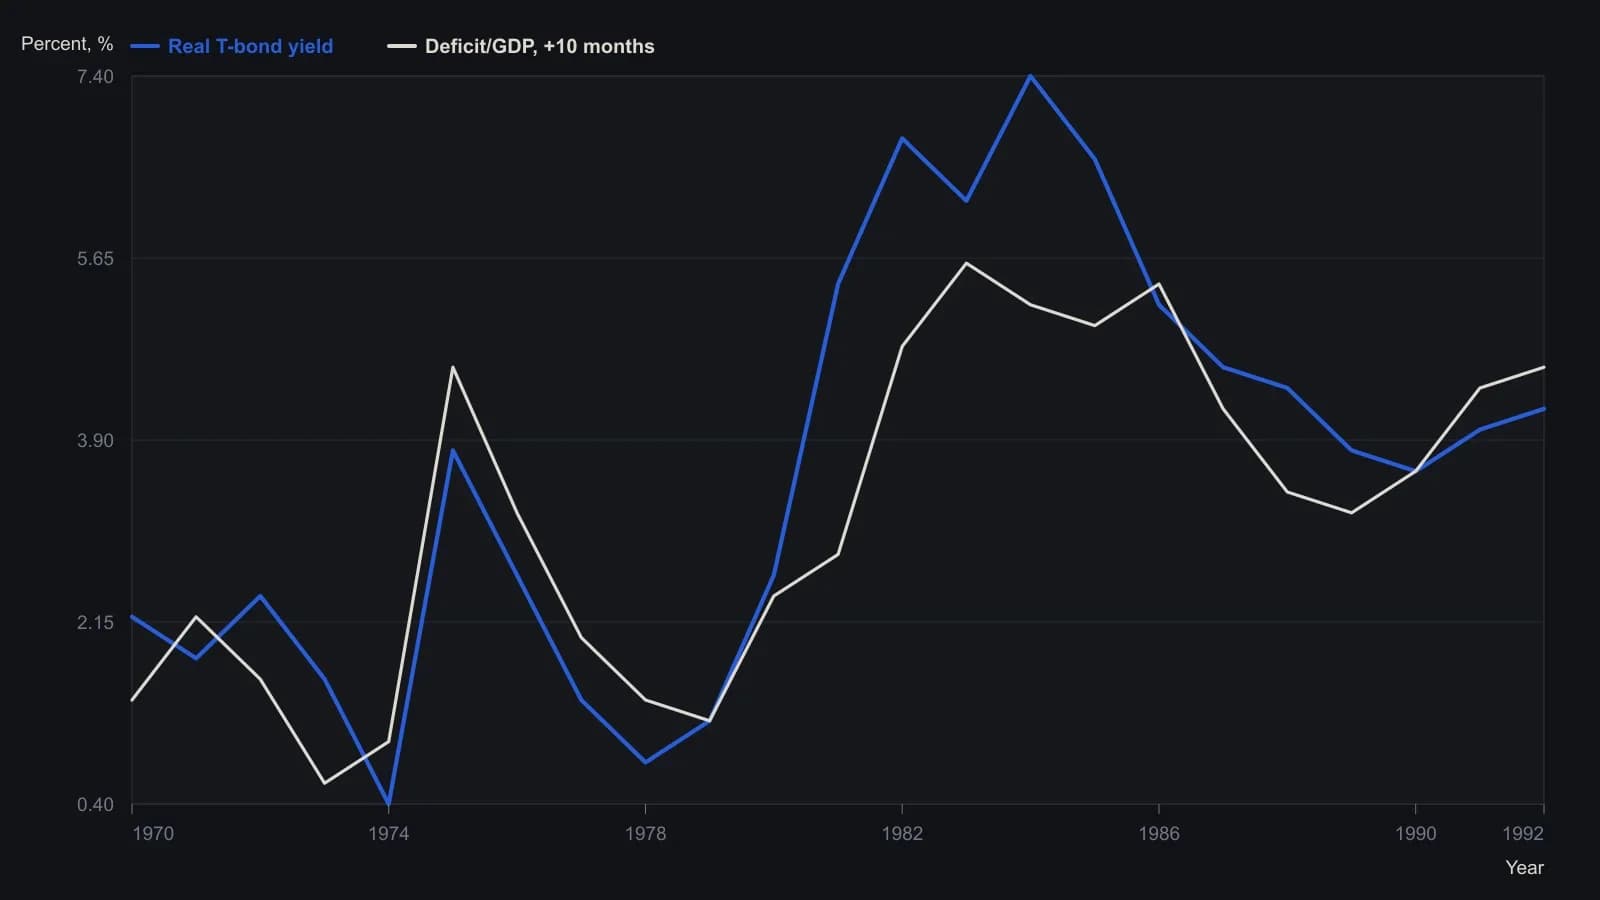
The source advances the combined state-and-federal deficit as a percent of GDP by 10 months. Values are approximate readings from the printed figure; the raster does not support extra decimal precision.
Frame the quoted coupon as a months-ahead regime
A nominal-yield-overlay combines a real-rate path inferred from public borrowing with a separate inflation-trend view to frame the coupon rate that is actually quoted.
Editorial: the archive workflow is a sequence of rival maps on one rate market. Inflation and activity are tested as standalone explanations first. What remains is read against the deficit-to-gdp-ratio so one bond idea is a months-ahead regime, not an inflation-only chart.
All readings on this track · 21 readings
- 1991Growth earnings and price-to-earnings as a market-regime overlay
- 1991Earnings-price reliability as a first gate for growth-sleeve construction
- 1991Growth-adjusted earnings years as construction filters
- 1992Constructing an index nominal from smoothed earnings and effective rates
- 1992Real bond yields as a deficit-share regime
- 1994Relative valuation as regime context for fund allocation
- 1995A flattening trendline as a critique of the fundamental overlay
- 1998An earnings-to-price mapping is unfinished until add, reduce, and stand-aside are rules
- 1999Regime-aware stock exposure when rates and market condition agree
- 2002Short-rate velocity regimes before tightening
- 2003A pre-trade checklist that requires rule and fundamental agreement
- 2004Evaluating P/E overlays with matched crossovers
- 2004Constructing a stock-versus-bond regime from earnings yields
- 2012Cash-rich relative strength as a pre-trade portfolio filter
- 2012Inactivity as a feature: a small-cap earnings overlay with a monthly average and weekly MACD
- 2015Evaluating a capitalization-to-output-ratio as a regime overlay
- 2016Risk-adjusted earnings yield as a portfolio overlay
- 2017Oil, yields, and implied volatility as a regime critique
- 2017When a one-year bull sits inside a secular bear
- 2018A critique of rules-only trading systems
- 2019When seasonal and policy regimes override crowd mood