2017issue C0214-19
Correlation regime versus moving-average crossover for S&P 500 exposure
The archive compared a long-or-cash correlation-strategy, built from inter-asset correlation across 29 exchange-traded funds, with an optimized moving-average-crossover and buy-and-hold on a 13-year weekly sample. Editorial reading: ask whether the basket is still moving with the S&P 500 before that week's exposure is accepted.
- The study used inter-asset correlation across 29 exchange-traded funds as a regime context for S&P 500 exposure, not the index series alone.
- On a 13-year weekly sample, the correlation-strategy recorded eight losing trades, or 19.05% of its transactions, versus 19 losers and 51.35% of transactions for the moving-average-crossover.
- Losing trades were held for an average of seven bars under the correlation-strategy and 4.6 bars under the moving-average-crossover, with at most two consecutive losses versus four.
- The authors ranked the correlation rule first among the three mechanical procedures on the reported profit and risk statistics, including a risk-reward-ratio of 0.84, an ulcer-index of 4.53, and a sharpe-ratio of 1.4.
A basket sets the regime
The study framed inter-asset correlation as a regime context for S&P 500 exposure. It measured that context on a basket of 29 exchange-traded funds rather than on the index series alone.
Inter-asset correlation is a measured tendency for that basket to move with the target index over a rolling window. It is used here as a regime filter, not as a forecast of any one price.
Three mechanical procedures
The correlation-strategy is a mechanical long-or-cash procedure. It holds the S&P 500 vehicle only while the basket correlation condition remains in the favorable state and stands aside otherwise.
The moving-average-crossover is a price-only entry and exit rule. It flips exposure when a faster average crosses a slower average of the same series. Buy-and-hold is a passive comparison path that stays fully invested in the same vehicle for the whole sample.
The authors treated the correlation rule, the optimized moving-average-crossover, and buy-and-hold as competing mechanical procedures.
Annualized SPY returns by strategy, 2003–2016
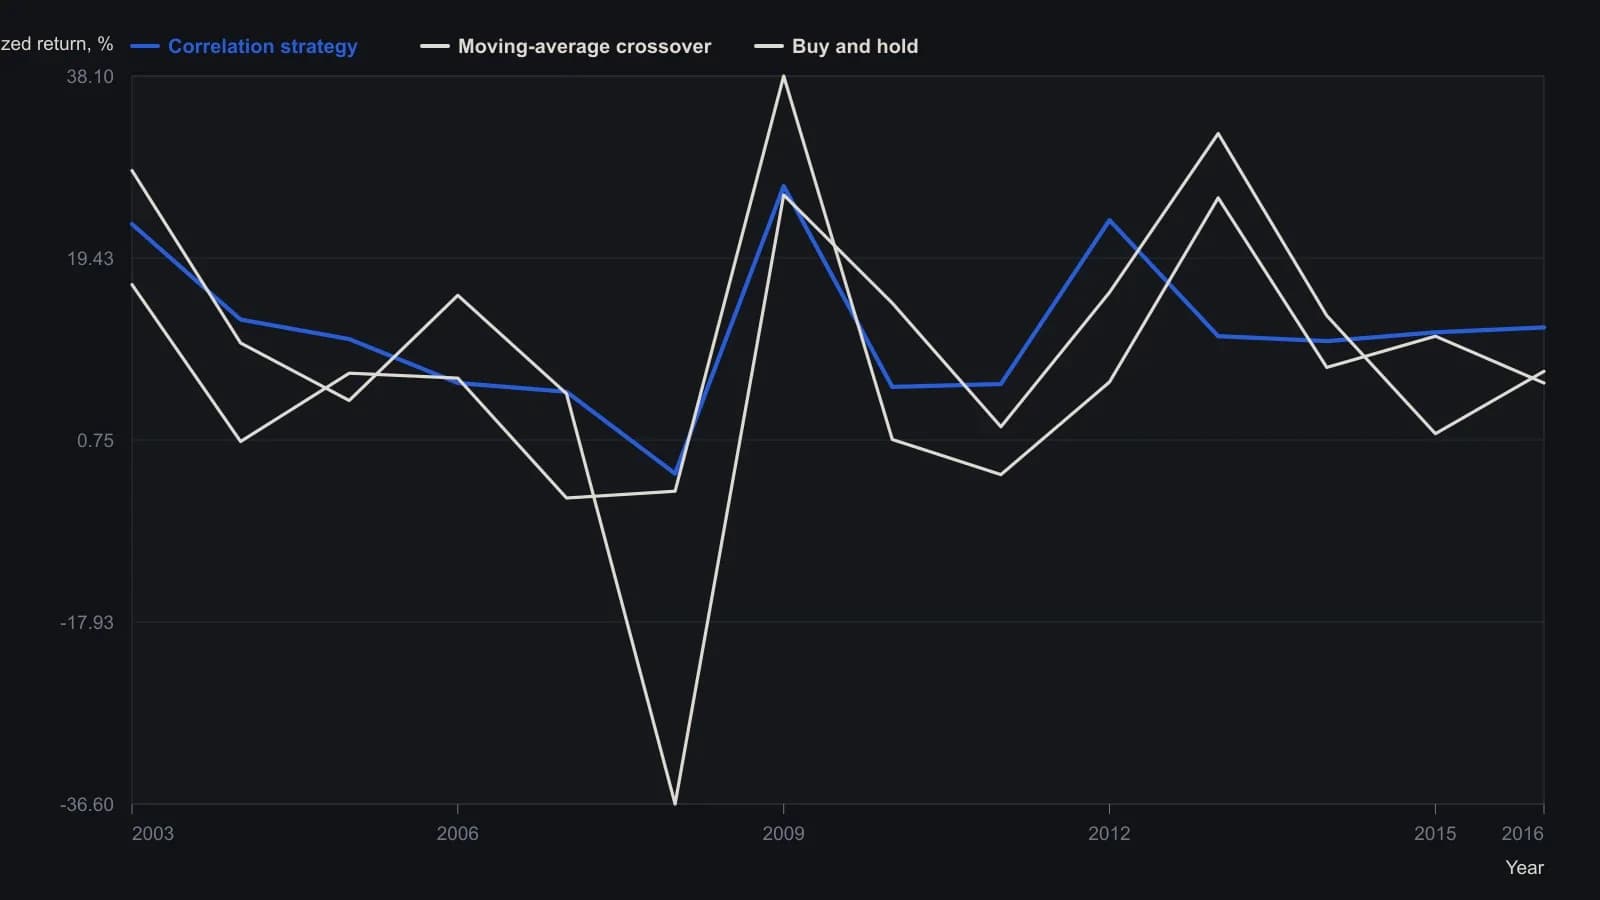
The long-or-cash rule used an eight-week SMA of 13-week average correlation across 29 ETFs. The crossover used an 18-week SMA chosen by in-sample optimization. Taxes, spreads and commissions were omitted. The 2016 row is year-to-date through 26 August, not a full calendar year.
Trade counts and streaks
Over a 13-year weekly sample, the correlation procedure recorded eight losing trades, or 19.05% of its transactions. The moving-average-crossover recorded 19 losers, or 51.35% of its transactions.
The correlation procedure's longest winning streak was seven trades, compared with five consecutive wins for the moving-average-crossover.
How long positions stayed open
The correlation procedure's largest winning holding lasted 15 weeks. The moving-average-crossover's largest winning holding lasted 44 weeks.
Losing trades were held for an average of seven bars under the correlation procedure and 4.6 bars under the moving-average-crossover. Bars-held counts the weekly bars a position remained open in the historical test. Consecutive losses reached at most two under the correlation procedure and four under the moving-average-crossover.
Risk statistics from the same sample
In the historical comparison, the correlation method's risk-reward-ratio was 0.84, ahead of 0.78 for the moving-average-crossover and 0.41 for buy-and-hold. The risk-reward-ratio is the average winning outcome divided by the average losing outcome over the tested trades.
Downside volatility, scored by the ulcer-index, was 4.53 for the correlation model, 6.73 for the moving-average-crossover, and 14.27 for buy-and-hold. The ulcer-index rises when drawdowns are deep or persistent.
The same sample assigned a sharpe-ratio of 1.4 to the correlation model and 0.25 to the moving-average-crossover. The sharpe-ratio is used here only as a historical comparison among the three procedures.
The authors ranked the correlation rule first on the reported profit and risk statistics.
All readings on this track · 37 readings
- 1988Constructing a lead-aware correlation coefficient
- 1989A precious-metal price as a changing intermarket equation
- 1990Two clocks for copper: a factor regime, a regression baseline, and leftover moving-average timing
- 1990Earnings yield, rate correlation and regression for equity value
- 1991Name the window, then combine leaders
- 1991Constructing a two-market linear correlation check
- 1991Constructing a commodity-bond correlation regime filter
- 1992Building intermarket context with linear correlation
- 1993Inverse-scale overlays as a gold-equity regime filter
- 1994Constructing seasonal slots from windows, analog years, and implied volatility
- 1995Pin one reference close and roll companion correlations as an overlay
- 1995Rolling correlation windows for shifting intermarket regimes
- 1998Gold as a cross-market regime barometer
- 1999The gold-bond inverse is a regime, not a cause
- 1999A nested lag test of gold leading bond yields
- 1999Constructing spreads from stock and intermarket correlation
- 2000Evaluating headline versus food-and-energy-excluded CPI as bond-yield context
- 2005A late EUR/USD fifth wave tested by the Bund-Treasury gap
- 2006Intermarket dislocation as context for short-horizon momentum
- 2008Map ordinary 12-month outcomes before stacking valuation, rates, and seasonality
- 2008A clean-energy theme inside the oil-and-energy regime
- 2014Quantitative-easing overlays as fragile belief regimes
- 2015Three intermarket checks from the late-2014 crude decline
- 2015Basket construction via rank, correlation, and locked rules
- 2015Construct a CAD-oil pair from percent-of-range Bollinger maps
- 2015CAD/USD and crude: first the correlation, then the band gap
- 2017Correlation regime versus moving-average crossover for S&P 500 exposure
- 2017Updating intermarket systems after correlation shifts
- 2017Constructing a correlation-divergence regime filter for yen and Nikkei context
- 2018Clustered negative troughs in an energy-index pairwise correlation
- 2018Filter pairwise-correlation before reading an intermarket regime
- 2018Moving-average supports in the March 2018 correlation shock
- 2020Bond spreads as an equity regime lens
- 2020Crash-protection folklore as a correlation regime question
- 2020Constructing a bounded correlation-trend-filter
- 2020Constructing a correlation-to-line trend filter
- 2020Bitcoin correlation regimes across equities and gold