2020issue C0146-47
Crash-protection folklore as a correlation regime question
A historical case study measured the crash-protection thesis with the Dow Jones Industrial Average and the HUI Gold Bugs Index. Rolling correlation regimes and selected intermarket case windows were used to show when the gold-complex series moved with equities and when it moved against them.
- The crash-protection thesis was measured with signed rolling correlation regimes, not assumed as one fixed hedge relationship.
- From 1 June 1996 through 18 October 2019 the full-sample correlation between the Dow Jones Industrial Average and the HUI Gold Bugs Index was -0.02332497 and was described as consistent with independence.
- In two listed intermarket case windows the HUI Gold Bugs Index rose while the Dow Jones Industrial Average fell; from 1 October 2007 to 9 March 2009 both declined.
- The case study concluded that gold-complex trends should be judged on their own merits because the HUI Gold Bugs Index did not typically track the Dow Jones Industrial Average lower.
Testing the crash-protection thesis
Conflicting views on whether gold-linked prices hold up in equity crises were tested with historical Dow Jones Industrial Average and HUI Gold Bugs Index valuations during corrections. The HUI Gold Bugs Index was the gold-complex series set opposite the equity benchmark.
The crash-protection thesis is the popular claim that gold-linked prices hold value when equities fall. In this case study it was treated as a hypothesis to measure rather than a rule to assume.
Signed regimes and the full-sample correlation
Rolling correlation spans between the two indexes were marked as positive or negative rather than treated as one fixed crash-hedge relationship. Each span is a correlation regime: a market interval in which the signed correlation stays positive or stays negative.
From 1 June 1996 through 18 October 2019 the full-sample correlation, the single average over that study window, was -0.02332497. That figure was described as consistent with independence.
Rolling DJIA–HUI correlation through six crash windows
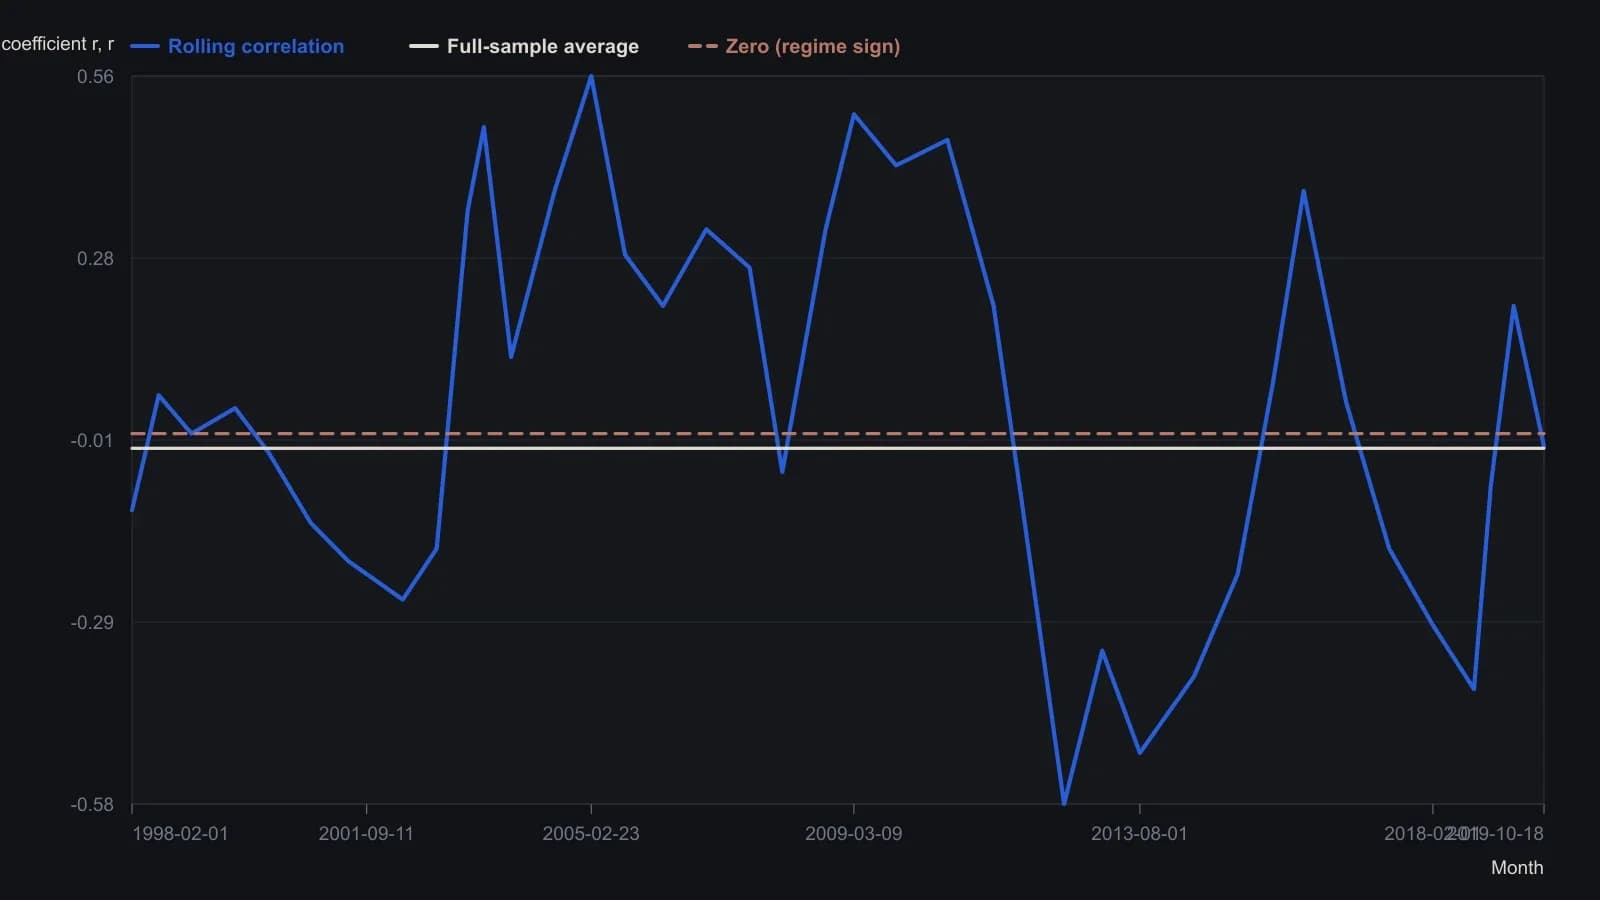
Read off the printed monthly rolling-correlation pane. The source does not state the rolling-window length; the series begins after a warm-up gap on the left of the figure. Green vertical spans mark the article’s positive-correlation crash windows and pink spans mark negative-correlation windows. Unlabeled dashed guides near ±0.4 are omitted. Coordinates are approximate to the raster.
Intermarket case windows
Six equity-stress episodes from 2000 through 2018 were listed as intermarket case windows, each with paired Dow Jones Industrial Average and HUI Gold Bugs Index levels at episode markers. The following windows were specified.
In the 11 September 2001 to 9 October 2002 window the Dow Jones Industrial Average declined from 8920 to 7286 while the HUI Gold Bugs Index rose from 67 to 108.
From 1 October 2007 to 9 March 2009 the Dow Jones Industrial Average fell from 12382 to 6547, a decline described as over 50 percent, while the HUI Gold Bugs Index fell from 345 to 275.
From the 20 September 2018 close to 24 December 2018 the Dow Jones Industrial Average declined 18.78 percent, from 26656 to 21792, while the HUI Gold Bugs Index rose from 144 to 161.
Judging gold-complex trends on their own
The case study concluded that gold-complex trends should be judged on their own merits because the HUI Gold Bugs Index did not typically track the Dow Jones Industrial Average lower through the examined crashes.
As a TradersWeek editorial reading, that conclusion is a portfolio-context decision rather than a slogan. Color when the gold-complex series moved with equities and when it moved against them, then treat a near-zero full-sample link as a reason to judge the series as its own trend inside a diversified book.
All readings on this track · 37 readings
- 1988Constructing a lead-aware correlation coefficient
- 1989A precious-metal price as a changing intermarket equation
- 1990Two clocks for copper: a factor regime, a regression baseline, and leftover moving-average timing
- 1990Earnings yield, rate correlation and regression for equity value
- 1991Name the window, then combine leaders
- 1991Constructing a two-market linear correlation check
- 1991Constructing a commodity-bond correlation regime filter
- 1992Building intermarket context with linear correlation
- 1993Inverse-scale overlays as a gold-equity regime filter
- 1994Constructing seasonal slots from windows, analog years, and implied volatility
- 1995Pin one reference close and roll companion correlations as an overlay
- 1995Rolling correlation windows for shifting intermarket regimes
- 1998Gold as a cross-market regime barometer
- 1999The gold-bond inverse is a regime, not a cause
- 1999A nested lag test of gold leading bond yields
- 1999Constructing spreads from stock and intermarket correlation
- 2000Evaluating headline versus food-and-energy-excluded CPI as bond-yield context
- 2005A late EUR/USD fifth wave tested by the Bund-Treasury gap
- 2006Intermarket dislocation as context for short-horizon momentum
- 2008Map ordinary 12-month outcomes before stacking valuation, rates, and seasonality
- 2008A clean-energy theme inside the oil-and-energy regime
- 2014Quantitative-easing overlays as fragile belief regimes
- 2015Three intermarket checks from the late-2014 crude decline
- 2015Basket construction via rank, correlation, and locked rules
- 2015Construct a CAD-oil pair from percent-of-range Bollinger maps
- 2015CAD/USD and crude: first the correlation, then the band gap
- 2017Correlation regime versus moving-average crossover for S&P 500 exposure
- 2017Updating intermarket systems after correlation shifts
- 2017Constructing a correlation-divergence regime filter for yen and Nikkei context
- 2018Clustered negative troughs in an energy-index pairwise correlation
- 2018Filter pairwise-correlation before reading an intermarket regime
- 2018Moving-average supports in the March 2018 correlation shock
- 2020Bond spreads as an equity regime lens
- 2020Crash-protection folklore as a correlation regime question
- 2020Constructing a bounded correlation-trend-filter
- 2020Constructing a correlation-to-line trend filter
- 2020Bitcoin correlation regimes across equities and gold