1998issue C101-4
Gold as a cross-market regime barometer
This Evaluation uses Intermarket analysis and Correlation analysis to score gold two ways: how often it agrees in direction with the dollar and CPI, and how stably its daily price ratio tracks the CRB. Across 40 quarters from 1988 through 1997, gold moved opposite the dollar versus the German mark in 65 percent of quarters and with quarterly CPI inflation in 70 percent. Over the prior 10 calendar years, gold posted the lowest average absolute deviation of a commodity-to-index daily price ratio versus the CRB.
- Across 40 quarters from 1988 through 1997, gold and the dollar versus the German mark moved in opposite directions in 26 quarters, or 65 percent of the sample.
- Across the same 40 quarters, the quarterly CPI inflation rate and gold moved in the same direction in 28 quarters, or 70 percent of the sample.
- Over the prior 10 calendar years gold posted the lowest average absolute deviation of a commodity-to-index daily price ratio versus the CRB, at 0.053, ahead of soybeans at 0.085 and platinum at 0.096.
- The evaluation frames gold as still useful as a regime barometer because gold declines usually coincide with softer inflation and commodities, while gold advances often coincide with a weaker dollar.
A regime check, not a daily substitute
This Evaluation sits in Intermarket and spreads. It applies Intermarket analysis and Correlation analysis to put gold into a regime-aware market context.
The historical workflow scores gold against the dollar, consumer prices, and a commodity index rather than treating one metal as a complete picture of inflation or of the basket.
Direction versus the dollar and CPI
Across 40 quarters from 1988 through 1997, gold and the dollar versus the German mark moved in opposite directions in 26 quarters, or 65 percent of the sample.
Across the same 40 quarters, the quarterly CPI inflation rate and gold moved in the same direction in 28 quarters, or 70 percent of the sample.
A same-direction quarter in 1990
In the third quarter of 1990 the dollar versus the mark fell 0.0945, from 1.6615 to 1.5670, while gold rose 42.6, from 359.90 to 402.50.
In that same quarter the quarterly inflation rate rose 0.91 to 2.00 percent from 1.09 percent while gold rose 42.6, a same-direction inflation-gold episode.
Why a commodity basket still matters in CPI
The CPI mix cited in the evidence is about 55 percent labor-intensive services and 45 percent commodity-intensive goods, so a commodity basket remains a large share of the inflation picture.
Stability of the gold-to-CRB daily ratio
Representativeness versus the CRB was scored with a six-step relative deviation of the daily ratio: form the daily commodity-to-index ratio, subtract the period mean, take absolute values, average those deviations, then divide by the mean.
That score is the average absolute deviation of a commodity-to-index daily price ratio, scaled by that ratio's mean.
Over the prior 10 calendar years gold posted the lowest relative deviation of the daily ratio versus the CRB, at 0.053, ahead of soybeans at 0.085 and platinum at 0.096.
In the same ranking coffee, orange juice, and natural gas were the least stable CRB stand-ins, at 0.274, 0.216, and 0.178.
What a low ratio deviation implies
When that gold-to-CRB daily-ratio deviation is low, the two series tend to rise and fall together rather than gold moving in isolation.
The evaluation frames gold as still useful as a regime barometer because gold declines usually coincide with softer inflation and commodities, while gold advances often coincide with a weaker dollar.
Relative deviation of each commodity’s daily ratio to the CRB
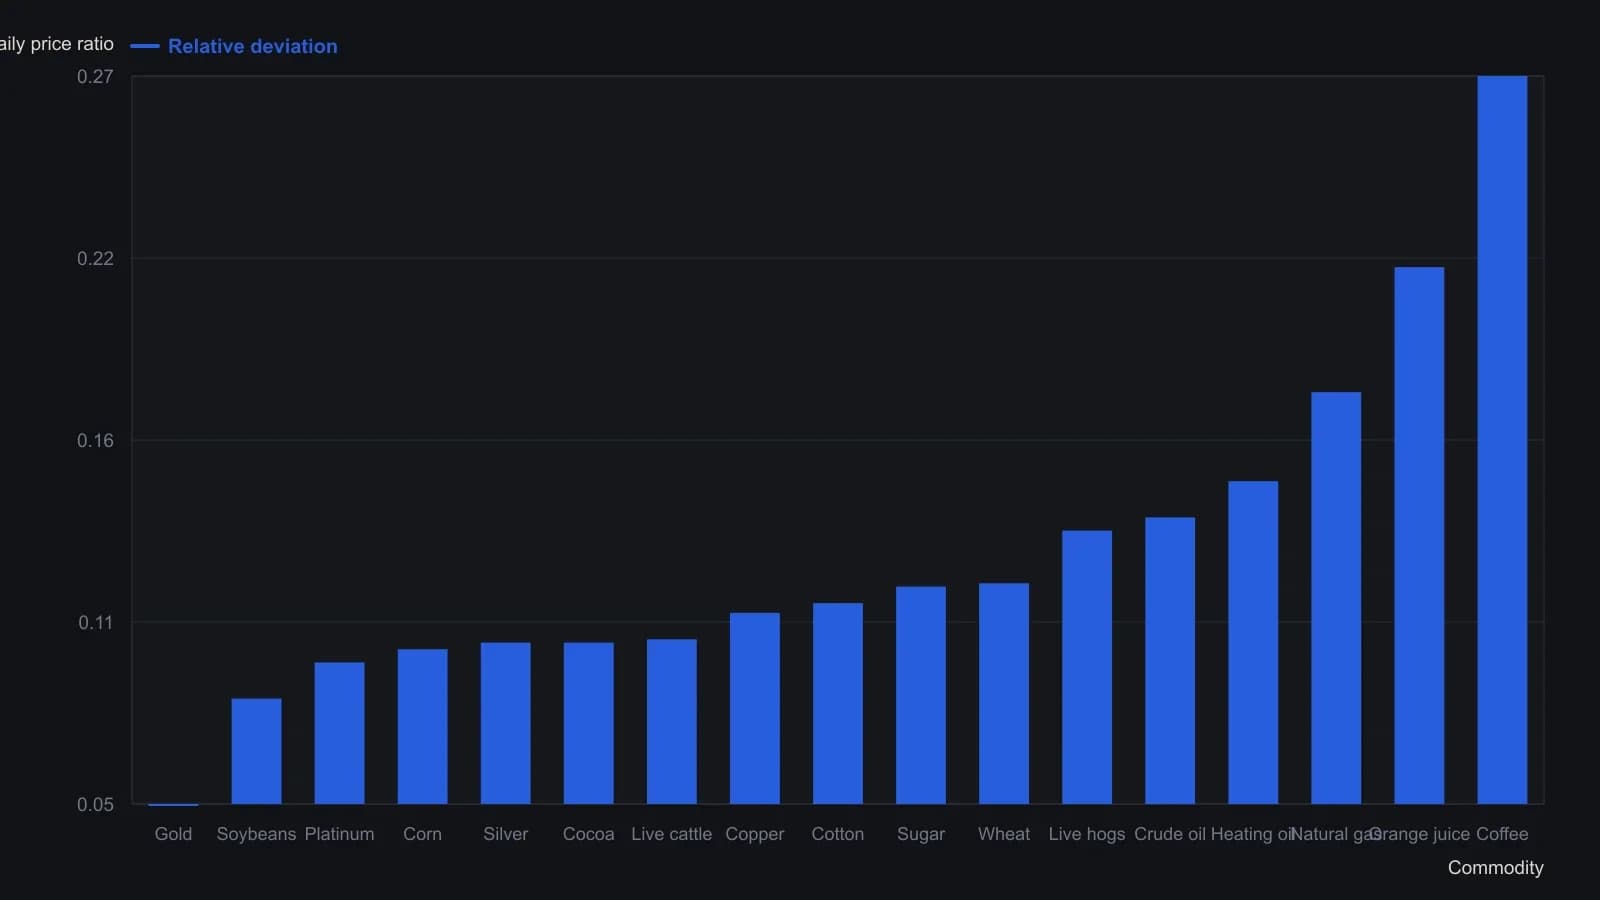
Relative deviation is the mean absolute deviation of the daily commodity/CRB price ratio, divided by that ratio’s mean. The window is the same 10 calendar years as the 1988–97 quarterly study.
All readings on this track · 37 readings
- 1988Constructing a lead-aware correlation coefficient
- 1989A precious-metal price as a changing intermarket equation
- 1990Two clocks for copper: a factor regime, a regression baseline, and leftover moving-average timing
- 1990Earnings yield, rate correlation and regression for equity value
- 1991Name the window, then combine leaders
- 1991Constructing a two-market linear correlation check
- 1991Constructing a commodity-bond correlation regime filter
- 1992Building intermarket context with linear correlation
- 1993Inverse-scale overlays as a gold-equity regime filter
- 1994Constructing seasonal slots from windows, analog years, and implied volatility
- 1995Pin one reference close and roll companion correlations as an overlay
- 1995Rolling correlation windows for shifting intermarket regimes
- 1998Gold as a cross-market regime barometer
- 1999The gold-bond inverse is a regime, not a cause
- 1999A nested lag test of gold leading bond yields
- 1999Constructing spreads from stock and intermarket correlation
- 2000Evaluating headline versus food-and-energy-excluded CPI as bond-yield context
- 2005A late EUR/USD fifth wave tested by the Bund-Treasury gap
- 2006Intermarket dislocation as context for short-horizon momentum
- 2008Map ordinary 12-month outcomes before stacking valuation, rates, and seasonality
- 2008A clean-energy theme inside the oil-and-energy regime
- 2014Quantitative-easing overlays as fragile belief regimes
- 2015Three intermarket checks from the late-2014 crude decline
- 2015Basket construction via rank, correlation, and locked rules
- 2015Construct a CAD-oil pair from percent-of-range Bollinger maps
- 2015CAD/USD and crude: first the correlation, then the band gap
- 2017Correlation regime versus moving-average crossover for S&P 500 exposure
- 2017Updating intermarket systems after correlation shifts
- 2017Constructing a correlation-divergence regime filter for yen and Nikkei context
- 2018Clustered negative troughs in an energy-index pairwise correlation
- 2018Filter pairwise-correlation before reading an intermarket regime
- 2018Moving-average supports in the March 2018 correlation shock
- 2020Bond spreads as an equity regime lens
- 2020Crash-protection folklore as a correlation regime question
- 2020Constructing a bounded correlation-trend-filter
- 2020Constructing a correlation-to-line trend filter
- 2020Bitcoin correlation regimes across equities and gold