2015issue C1249-55
Construct a CAD-oil pair from percent-of-range Bollinger maps
Oil-exporting currencies are treated as positively linked to crude, so this archive article constructs the Canadian dollar versus oil. Each series is mapped to a percent-of-range-band, intermarket-divergence is the gap between those maps, and a correlation-gate allows or vetoes the pair.
- Treat the Canadian dollar as a petrocurrency and build the pair as the Canadian dollar versus oil, not as a fixed one-to-one link.
- Place each series on a shared-lookback percent-of-range-band, then read intermarket-divergence as the percent gap of the oil map versus the CAD map.
- A correlation-gate must stay above minus 0.4 on a 20-session window at entry, and a 60-session reading below minus 0.4 plus a 15-session price extreme is treated as a regime-break exit.
- The construction is described as most useful while crude is volatile and trending, and as likely to pause in a range-bound-oil-regime such as 2011-2013.
Start from the petrocurrency pair
Oil-exporting currencies are treated as positively linked to crude, and the constructed pair is the Canadian dollar versus oil. The Canadian dollar versus the US dollar is the petrocurrency here: a currency whose exchange rate is typically driven by the oil-export economy behind it.
The oil-CAD link is treated as usually positive but not a constant 1.0, because policy rates and carry can periodically dominate.
The CAD-oil pair is also constructed from a trade-flow story. Canada's main export destination is the United States, so oil-price swings are treated as USD-flow swings into the Canadian dollar.
Map both series on a shared lookback
Each series is mapped to a percent-of-range-band, a same-lookback map that places the latest close between the lower and upper two-standard-deviation Bollinger bands.
Those maps share one shared-lookback: the common sampling window used for both Bollinger maps and the short-horizon correlation check. The default construction uses a 20-session lookback and a 0.0001 floor in the band-width denominator so a flat standard deviation cannot divide by zero.
Read intermarket divergence, then wait for a reversal
Intermarket-divergence is then the percent gap of the oil map versus the CAD map after both series share that lookback.
Long and short setups require a 3-session extreme of that divergence beyond plus or minus 20, plus confirmation that the divergence is already reversing.
CAD–oil Bollinger-band divergence, summer 2015
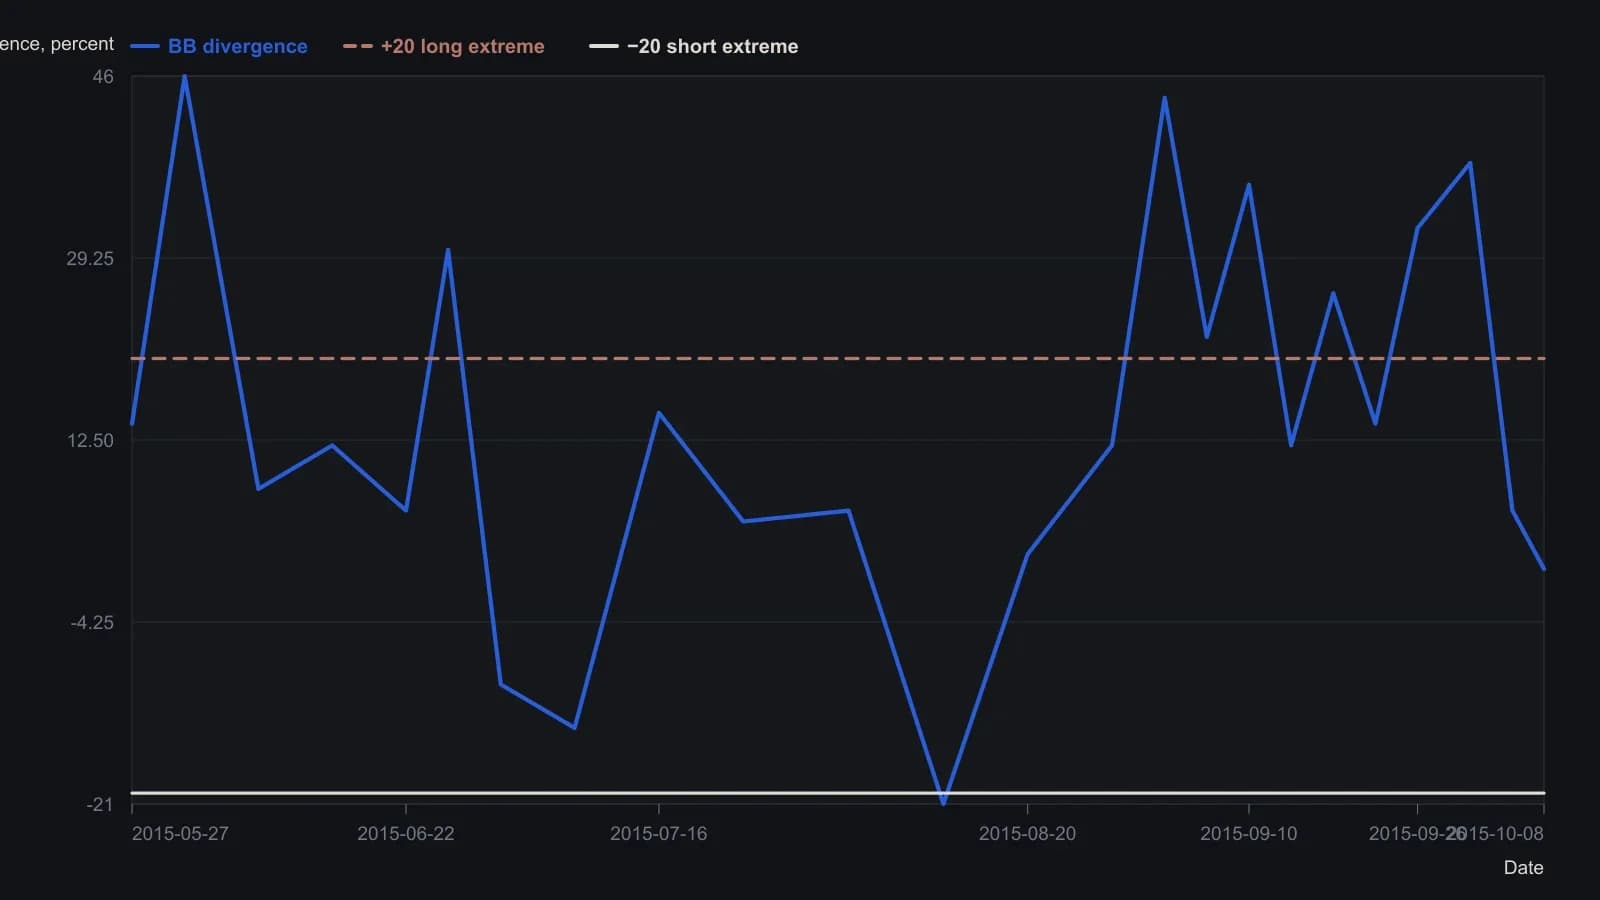
Each leg is mapped as 1 + (close − 20-day SMA + 2σ) / (4σ). Divergence is (oil map − CAD map) / CAD map × 100. A 20-day correlation reading below −0.4 vetoes a new pair trade. Digitized points are whole numbers except the labeled close.
Install the correlation gate
A correlation-gate is a rolling CAD-oil correlation filter that blocks entry or forces exit when the oil link has weakened or flipped.
A 20-session CAD-oil correlation above minus 0.4 is required at entry so the pair is taken only while the intermarket link has not inverted. That short-horizon check uses the same shared-lookback as the two maps.
A 60-session correlation below minus 0.4 is used as an exit when price also breaks a 15-session extreme, treating a sign flip in the oil link as a regime break.
Pause in a range-bound oil regime
The same construction is described as most useful while crude is volatile and trending, and as likely to pause in a prolonged range such as 2011-2013.
That setting is a range-bound-oil-regime: a prolonged sideways crude period in which the same divergence construction is expected to pause rather than keep firing.
All readings on this track · 37 readings
- 1988Constructing a lead-aware correlation coefficient
- 1989A precious-metal price as a changing intermarket equation
- 1990Two clocks for copper: a factor regime, a regression baseline, and leftover moving-average timing
- 1990Earnings yield, rate correlation and regression for equity value
- 1991Name the window, then combine leaders
- 1991Constructing a two-market linear correlation check
- 1991Constructing a commodity-bond correlation regime filter
- 1992Building intermarket context with linear correlation
- 1993Inverse-scale overlays as a gold-equity regime filter
- 1994Constructing seasonal slots from windows, analog years, and implied volatility
- 1995Pin one reference close and roll companion correlations as an overlay
- 1995Rolling correlation windows for shifting intermarket regimes
- 1998Gold as a cross-market regime barometer
- 1999The gold-bond inverse is a regime, not a cause
- 1999A nested lag test of gold leading bond yields
- 1999Constructing spreads from stock and intermarket correlation
- 2000Evaluating headline versus food-and-energy-excluded CPI as bond-yield context
- 2005A late EUR/USD fifth wave tested by the Bund-Treasury gap
- 2006Intermarket dislocation as context for short-horizon momentum
- 2008Map ordinary 12-month outcomes before stacking valuation, rates, and seasonality
- 2008A clean-energy theme inside the oil-and-energy regime
- 2014Quantitative-easing overlays as fragile belief regimes
- 2015Three intermarket checks from the late-2014 crude decline
- 2015Basket construction via rank, correlation, and locked rules
- 2015Construct a CAD-oil pair from percent-of-range Bollinger maps
- 2015CAD/USD and crude: first the correlation, then the band gap
- 2017Correlation regime versus moving-average crossover for S&P 500 exposure
- 2017Updating intermarket systems after correlation shifts
- 2017Constructing a correlation-divergence regime filter for yen and Nikkei context
- 2018Clustered negative troughs in an energy-index pairwise correlation
- 2018Filter pairwise-correlation before reading an intermarket regime
- 2018Moving-average supports in the March 2018 correlation shock
- 2020Bond spreads as an equity regime lens
- 2020Crash-protection folklore as a correlation regime question
- 2020Constructing a bounded correlation-trend-filter
- 2020Constructing a correlation-to-line trend filter
- 2020Bitcoin correlation regimes across equities and gold