2014issue C0548-50
Quantitative-easing overlays as fragile belief regimes
A 2008-2009 dollar story, a later gold overlay, a sterling comparison, and a revived equity mapping all treated quantitative easing as a stable cause. Editorial practice is to classify each overlay as a belief-sensitive market regime and to write the correlation's failure condition while the chart still looks convincing.
- Treat a popular quantitative-easing-versus-asset overlay as a classified market regime, not a permanent intermarket law.
- Write the correlation's failure condition while the balance-sheet overlay still looks convincing.
- Dollar, gold, and sterling mappings changed while large-scale asset purchases continued.
- A belief regime can end without a balance-sheet reversal and without a consensus cause after the break.
Treat the overlay as a regime
Editorial note: treat every popular quantitative-easing-versus-asset overlay as a classified market regime rather than a permanent intermarket law.
A 2008-2009 intermarket narrative treated US quantitative easing as a cause of large dollar depreciation, and the dollar did weaken through most of 2009 after the March 2009 program announcement. Quantitative easing is a central-bank program of large-scale asset purchases that expands the policy balance sheet after conventional rate cuts are exhausted.
The dollar overlay faded
That dollar-to-balance-sheet mapping later faded. About five years into the experiment the dollar was characterized as mid-range even as the Federal Reserve balance sheet rose from roughly 1 trillion to 4 trillion dollars and was still growing by 85 billion dollars a month.
Editorial reading: a balance-sheet overlay plots the policy balance sheet against an asset price to argue that the former explains the latter. Intermarket analysis is the habit of reading the dollar through that contemporaneous policy series. Correlation analysis then asks whether the co-movement survives a later window. Here it did not.
Gold looked supportive, then broke
A replacement gold-versus-balance-sheet narrative looked supportive in 2010, 2011, and most of 2012, then gold fell in 2013 while the same balance sheet kept climbing.
After the 2013 gold break, the metal was described as about 550 dollars below its highs while large-scale asset purchases continued, leaving little visual support for a stable positive correlation.
Sterling rose with United Kingdom purchases
In a United Kingdom comparison, sterling rose as that country's quantitative easing increased, which contradicted a simple regime in which more easing must weaken the home currency.
Equities revived a tight purchase mapping
Following a September decision not to reduce purchases and a new chair nomination, equity commentary revived a tight mapping from multi-year US easing to higher stock prices.
Over the preceding five years, a common description of the equity regime was that stocks declined when purchases slowed and advanced when purchases restarted.
Editorial note: a taper is a reduction in the pace of official asset purchases, as distinct from an outright reversal of the balance-sheet stock. The September decision not to reduce purchases was a decision not to taper, not a reversal of the balance-sheet stock.
Fed total assets versus S&P 500 futures, 2008–2013
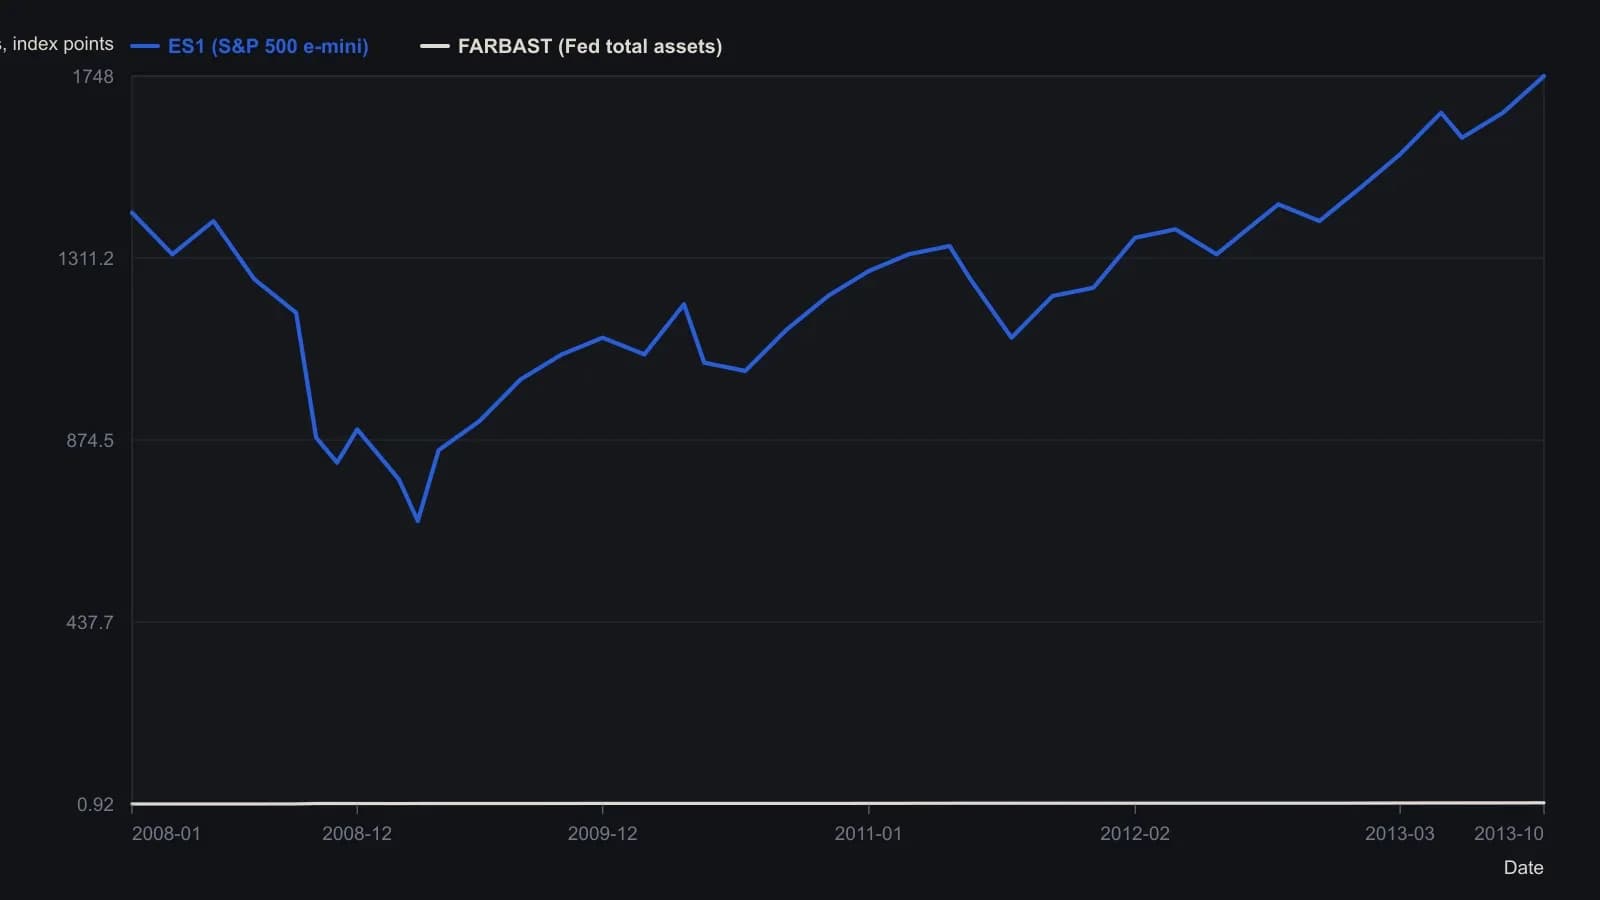
Dual-axis Bloomberg overlay; each series is reported in its own units. FARBAST is millions of dollars of Federal Reserve total assets. Sampled from the raster, so levels are approximate except the legend last prices.
Classify the break as a belief regime
The critique treats these quantitative-easing-to-asset links as belief-sensitive market regimes that can end even if the balance-sheet trend does not, sometimes without a consensus causal explanation after the break.
A belief regime is a period when a widely shared causal story organizes positioning until a psychological break leaves the same policy path producing a different asset response. Market-regime classification labels that stretch of market history as a distinct belief or policy state that can start, persist, and end without the underlying policy tool reversing.
The same discussion pointed to research, including work from the central bank itself, arguing that quantitative easing has limited real-economy effects outside crises, while growth was still described as oscillating in a 1 to 3 percent range.
Write the failure condition early
Editorial practice: write the correlation's failure condition while the chart still looks convincing. The failure condition is not a claim that the balance sheet will shrink. It is the statement that the asset can stop following large-scale asset purchases even if the balance-sheet trend does not reverse, and that after the break there may be no consensus causal explanation.
All readings on this track · 37 readings
- 1988Constructing a lead-aware correlation coefficient
- 1989A precious-metal price as a changing intermarket equation
- 1990Two clocks for copper: a factor regime, a regression baseline, and leftover moving-average timing
- 1990Earnings yield, rate correlation and regression for equity value
- 1991Name the window, then combine leaders
- 1991Constructing a two-market linear correlation check
- 1991Constructing a commodity-bond correlation regime filter
- 1992Building intermarket context with linear correlation
- 1993Inverse-scale overlays as a gold-equity regime filter
- 1994Constructing seasonal slots from windows, analog years, and implied volatility
- 1995Pin one reference close and roll companion correlations as an overlay
- 1995Rolling correlation windows for shifting intermarket regimes
- 1998Gold as a cross-market regime barometer
- 1999The gold-bond inverse is a regime, not a cause
- 1999A nested lag test of gold leading bond yields
- 1999Constructing spreads from stock and intermarket correlation
- 2000Evaluating headline versus food-and-energy-excluded CPI as bond-yield context
- 2005A late EUR/USD fifth wave tested by the Bund-Treasury gap
- 2006Intermarket dislocation as context for short-horizon momentum
- 2008Map ordinary 12-month outcomes before stacking valuation, rates, and seasonality
- 2008A clean-energy theme inside the oil-and-energy regime
- 2014Quantitative-easing overlays as fragile belief regimes
- 2015Three intermarket checks from the late-2014 crude decline
- 2015Basket construction via rank, correlation, and locked rules
- 2015Construct a CAD-oil pair from percent-of-range Bollinger maps
- 2015CAD/USD and crude: first the correlation, then the band gap
- 2017Correlation regime versus moving-average crossover for S&P 500 exposure
- 2017Updating intermarket systems after correlation shifts
- 2017Constructing a correlation-divergence regime filter for yen and Nikkei context
- 2018Clustered negative troughs in an energy-index pairwise correlation
- 2018Filter pairwise-correlation before reading an intermarket regime
- 2018Moving-average supports in the March 2018 correlation shock
- 2020Bond spreads as an equity regime lens
- 2020Crash-protection folklore as a correlation regime question
- 2020Constructing a bounded correlation-trend-filter
- 2020Constructing a correlation-to-line trend filter
- 2020Bitcoin correlation regimes across equities and gold