1993issue C091-14
Premarket setup selection and opening-range rules
After a multi-year learning period, analysis finished after the prior close. The next session opened with a written sheet: prior high and low, a chosen breakout or swing mode, and a short list of candidates.
- Indicator knowledge existed for years before it could be applied as a selective, written decision process.
- The next open began with the prior high and low, a chosen breakout or swing mode, and a short candidate list rather than an attempt to trade every scanned market.
- A planned buy was abandoned if price failed to hold the prior low and broke with continuation.
- Risk planning treated short-term results as uneven and tails as fatter than a bell curve implies, so the process stayed through many small outcomes.
The trader described a multi-year learning period in which indicator knowledge existed before it could be applied selectively. A usable decision process took several years to form.
Trade generation was then narrowed to recurring setups rather than fitting every market into one indicator framework. The named examples were buying a pullback to a moving average in a trend, and acting on a 10-day oscillator divergence with a double bottom.
A process before more markets
Watchlist size was expanded only after the process was systematized. More markets increase the chance of a few high-quality conditions, and they also increase the management load. Simultaneous positions were kept well below the number of markets scanned.
Write the session the night before
Analysis was completed after the prior close so the next session opened with a written order sheet. That sheet used the prior high and low as reference points, named a chosen breakout or swing mode, and listed a short set of buy or sell candidates. It was not an attempt to trade every scanned market.
The planned next-day rule uses the prior session high and low as the reference range and either buys or sells a break of that range or fades it, depending on the mode chosen the night before.
If a planned buy failed to hold the prior low and instead broke with continuation, the trade was abandoned. Execution was treated as separate from analysis. Technical work was used to frame probabilities, while trading skill managed entries, exits, and risk.
The written pre-session routine turns analysis, trade selection, entry, exit, and abstention into one testable procedure rather than a mix of indicators and impulse.
Divergence inside a trend
In a trend, the described rule set bought pullbacks confirmed by an oscillator and delayed fading the trend until one or two divergences appeared.
Divergence here is a repeatable chart condition in which price makes a new extreme while a companion oscillator does not. It is used as a buy or fade hypothesis rather than a standalone forecast.
A soybean example used a 10-day divergence in which price made a lower low while the oscillator made a higher high. The buy came after a multi-day selloff, a successful retest of the low, and the first up day.
A narrow seven-day range was presented as a low-volatility condition that can precede a trend. Contraction was used as a setup input rather than as a completed signal.
November soybeans daily close after the 10-day divergence
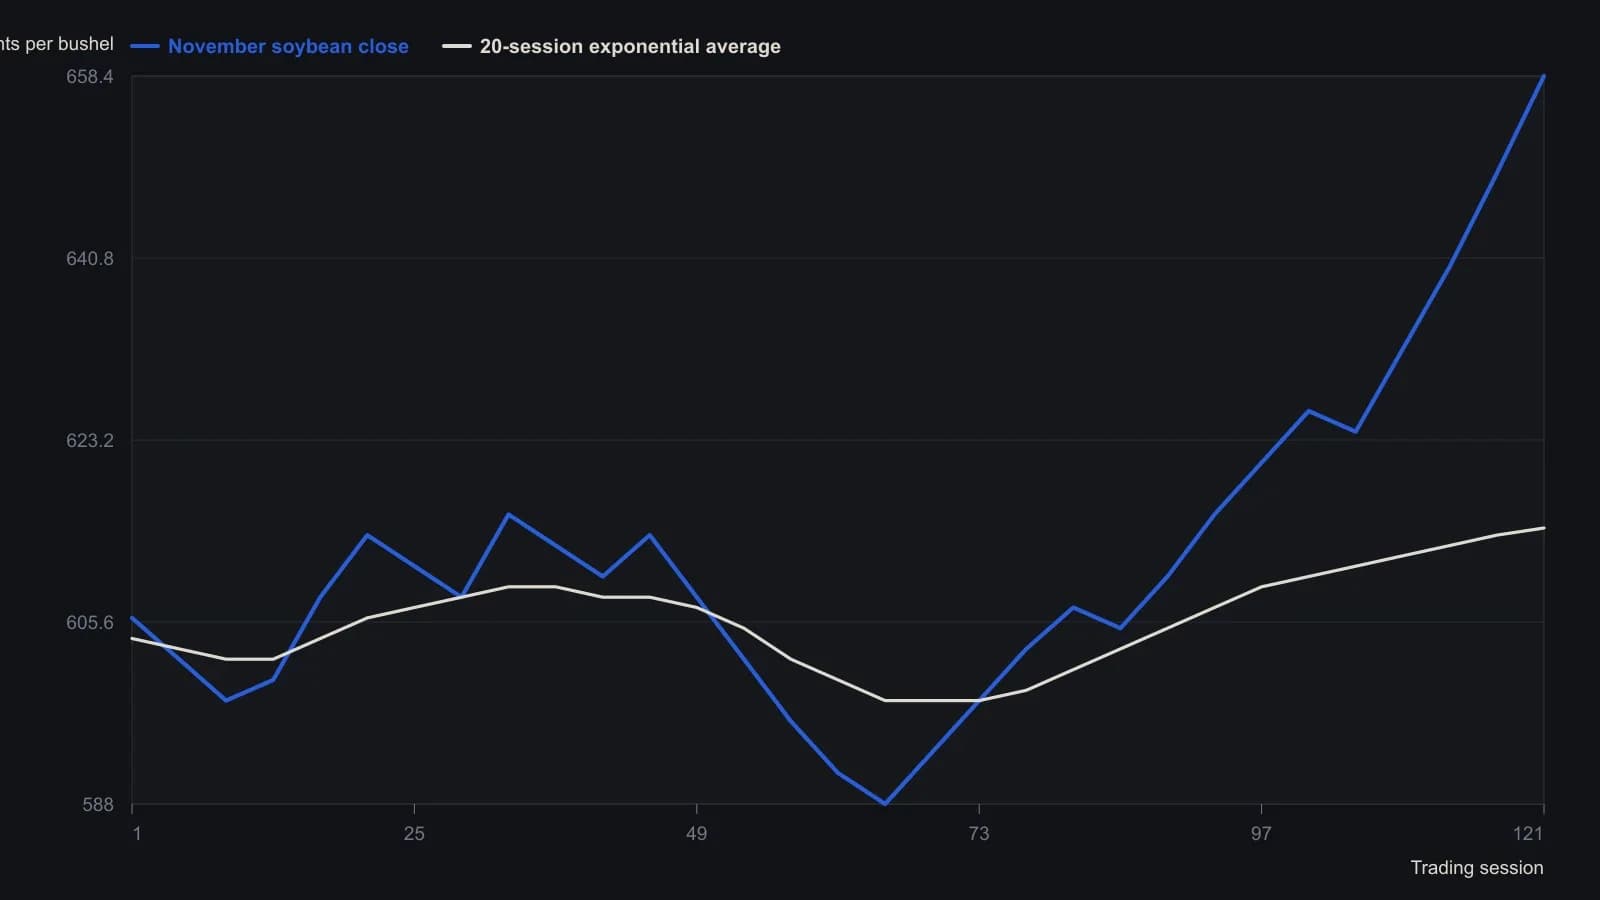
The printed display covers 121 daily sessions ending 30 June 1993. Intermediate closes are sampled every fourth session and rounded to the nearest cent. The final close 658.4 and the 20-period exponential 614.69 are panel readouts. The 3-minus-10 oscillator in the upper pane uses a different unit and is omitted.
Observation and live conditions
Most pattern work was said to come from observation rather than exhaustive testing. Isolated tests of crossovers or price patterns omit reports, volume, and intermarket conditions that change live outcomes. Isolated patterns can still be tested, but live conditions do not repeat exactly.
Plan for uneven outcomes
Risk planning treated distribution tails as fatter than a standard bell curve implies and treated short-term system results as uneven, with a small share of trades supplying most of the gains. The process stays in the game through many small outcomes while waiting for infrequent large ones.
All readings on this track · 25 readings
- 1988Early entry as the session switch for an opening-range breakout
- 1989Evaluating inside-day filters on opening-range breakouts
- 1989Opening-range breakout after a narrow-range-four session
- 1989A joint contraction setup as the arming switch for an opening-range breakout
- 1989Next-session opening-range rules after a bear hook
- 1989Same-session exits from multi-day open-close codes
- 1989A close-to-close sequence is a bias label, not a trigger
- 1989Inside-day contraction as a same-session open-to-close rule
- 1990Evaluating five-day soybean open-to-close rules
- 1990Hourly breakouts gated by absolute tick volume
- 1993Premarket setup selection and opening-range rules
- 1994First-hour opening-range construction as a refusal problem
- 1995Why historically tested rules fail without a decision process
- 2001The opening range as a measuring stick for a ladder breakout
- 2001Evaluating an opening reaction as one timed stop procedure
- 2003Swing trading, opening-range checks, and the decision to stand aside
- 2006Monitor each opening-range setup as its own regime
- 2006Midday breakout rules from the opening range
- 2007Opening-range breakout as one session procedure
- 2007Evaluating same-day opening range entry rules
- 2008Overnight auction regimes and the intraday hold-or-exit choice
- 2010Construct a market-state-first range-breakout system as one procedure
- 2013Opening-hour stop as a session filter
- 2017Overnight volume as a construction step for the opening-range breakout
- 2017Night-volume gate for opening range breakouts