2013issue C0816-23
Opening-hour stop as a session filter
A historical first-hour long placed a sell Stop-loss order under the 9:30 print and cancelled any unfilled stop at 10:30. Fill cadence, through-the-trigger recording, and a pre-open volume screen can flip that same order from a saver to a drag versus holding the opening hour. TradersWeek scores that contrast as editorial Session analysis, not as an archive verdict.
- The historical test always opened a long at the 9:30 print with a sell Stop-loss order under that print, then cancelled any unfilled stop and exited at 10:30.
- A 0.25 percent stop filled on 359 of 743 days, about once every 2.07 sessions. Stops at 0.50, 0.75, and 1.00 percent filled 150, 56, and 23 times, and smaller percentage stops produced higher aggregate stop expense over the same window.
- None of the four stop distances beat an unstopped 9:30-to-10:30 hold. Each left a negative opportunity gap versus that first-hour long.
- On 165 days when 7:30 to 8:30 volume exceeded two million shares, a 0.25 percent stop printed +2.27 against a -3.32 opening hour, while a 0.50 percent stop printed -5.39. TradersWeek reads that split, editorially, as a Session analysis screen rather than a default backstop.
What the historical test did
The historical test always opened a long at the 9:30 print and placed a sell Stop-loss order under that print. Any unfilled stop was cancelled, and the long was exited at 10:30. The sample covered 743 sessions from 1 June 2010 through 13 May 2013 and omitted commissions plus catastrophic gaps through the stop.
TradersWeek treats that 9:30 entry, the Stop-loss order, and the 10:30 exit as one Opening range breakout procedure. The live question is whether the stop is a session filter or only a default backstop. That framing is editorial.
Fill cadence and booked cost
A 0.25 percent stop filled on 359 of 743 days, about once every 2.07 sessions. A 0.50 percent stop filled 150 times, a 0.75 percent stop filled 56 times, and a 1.00 percent stop filled 23 times. Smaller percentage stops produced higher aggregate stop expense than wider stops over the same 743-day window.
Recorded stop exits used the trigger as the fill even though the actual print was often a penny or more through the order. TradersWeek treats that recording gap, editorially, as Session analysis of through-the-trigger cost, not as a reason to ignore how often the tightest stop was hit.
The unstopped first hour
None of the four stop distances beat an unstopped 9:30-to-10:30 hold. Each left a negative opportunity gap versus that first-hour long.
Opening-hour losses of a dollar or more occurred 20 times in 743 days, about once every 37.15 sessions. TradersWeek notes, editorially, that those large losses were rare next to a 0.25 percent fill about once every 2.07 sessions, so a standing backstop was doing most of its work on ordinary days rather than on the rare dollar-plus hour.
A pre-open volume screen
On 165 days when 7:30 to 8:30 volume exceeded two million shares, the next opening hour netted -3.32. A 0.25 percent stop then printed +2.27, while a 0.50 percent stop printed -5.39.
The same Stop-loss order family flipped from a saver to a drag once the distance widened, and only after that pre-open volume cut. TradersWeek scores the cut, editorially, as Session analysis of when the opening hour was hostile, not as a case for making the tight stop automatic.
One concentrated stretch
In the 30 sessions from 15 July to 25 August 2011, a 0.25 percent stop turned a -3.54 opening-hour result into +2.18. The 75 days before and the 30 days after showed opportunity gaps of -2.54 and -5.52.
A stop that helped inside one concentrated stretch was a drag in the windows around it. TradersWeek reads that pattern, editorially, as another reason to score the opening-hour stop as a conditional session filter rather than as a standing backstop.
0.25% opening-hour stop versus holding around the 2011 slide
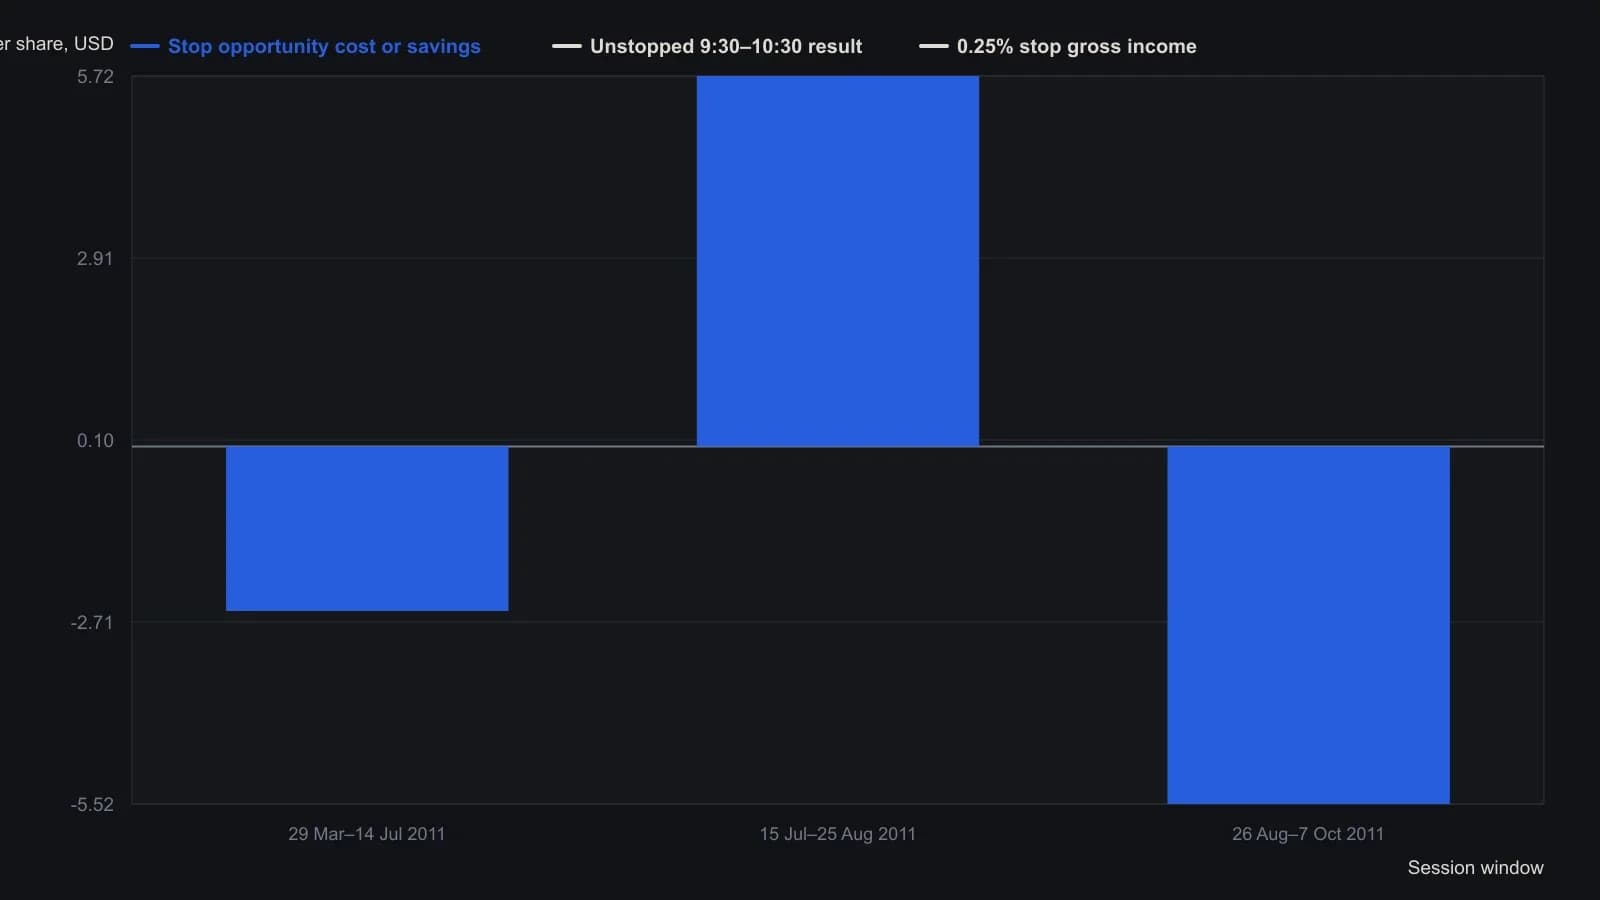
The test buys SPY at the 9:30 print, rests a sell stop 0.25 percent below that print, and cancels any unfilled stop at 10:30. Fills are booked at the stop price, which the author notes often understates slippage by a penny or more. Commissions and gap shocks are omitted. The three windows last 75, 30, and 30 sessions.
How TradersWeek scores the order
TradersWeek scores the opening-hour Stop-loss order as a Session analysis filter attached to an Opening range breakout first-hour hold. Fill cadence, through-the-trigger cost, and a pre-open volume screen can flip the same order from a saver to a drag versus simply holding the first hour. That score is editorial. The archive records the historical workflow and does not issue the verdict.
All readings on this track · 25 readings
- 1988Early entry as the session switch for an opening-range breakout
- 1989Evaluating inside-day filters on opening-range breakouts
- 1989Opening-range breakout after a narrow-range-four session
- 1989A joint contraction setup as the arming switch for an opening-range breakout
- 1989Next-session opening-range rules after a bear hook
- 1989Same-session exits from multi-day open-close codes
- 1989A close-to-close sequence is a bias label, not a trigger
- 1989Inside-day contraction as a same-session open-to-close rule
- 1990Evaluating five-day soybean open-to-close rules
- 1990Hourly breakouts gated by absolute tick volume
- 1993Premarket setup selection and opening-range rules
- 1994First-hour opening-range construction as a refusal problem
- 1995Why historically tested rules fail without a decision process
- 2001The opening range as a measuring stick for a ladder breakout
- 2001Evaluating an opening reaction as one timed stop procedure
- 2003Swing trading, opening-range checks, and the decision to stand aside
- 2006Monitor each opening-range setup as its own regime
- 2006Midday breakout rules from the opening range
- 2007Opening-range breakout as one session procedure
- 2007Evaluating same-day opening range entry rules
- 2008Overnight auction regimes and the intraday hold-or-exit choice
- 2010Construct a market-state-first range-breakout system as one procedure
- 2013Opening-hour stop as a session filter
- 2017Overnight volume as a construction step for the opening-range breakout
- 2017Night-volume gate for opening range breakouts