2005issue C031-4
A finished crude-oil top as a classroom for necklines, candles, and gaps
Light crude was described as having completed a head-and-shoulders top that could mark the end of a long-term rally begun in late 1999. The TradersWeek editorial reading treats that finished energy-market structure as a nested classroom: the neckline states that swing structure has reversed, candlesticks time the internal turns, and a breakaway gap plus a polarity shelf decide whether the measured move still deserves to stand.
- A close through the upward-sloping neckline on December 1 completed the top, with a more conservative filter of two successive closes beneath that line.
- Candlestick turns marked the internal swings: bearish engulfing at both shoulders, a morning star after the left-shoulder pullback, a bearish belt-hold at the head, and a mid-November hammer plus piercing pair at the neckline.
- The December 1 gap at 45.35 was labeled a potential breakaway gap; heavier volume made a fill less likely, and leaving it open for a week was said to increase the chance a larger move had started.
- Polarity in the mid-35 area could raise the raw 34.93 measured-move objective toward 35.50, while a close above the right shoulder would invalidate the reversal hypothesis.
A nested classroom on a finished top
The TradersWeek editorial reading treats this finished energy-market top as a nested classroom. The neckline states that swing structure has reversed. Candlesticks time the internal turns. A breakaway gap plus a polarity shelf decide whether the measured move still deserves to stand.
The archive described light crude as having completed a head-and-shoulders top that could mark the end of a long-term rally that began in late 1999. A head-and-shoulders, in the sense used here, is a three-swing top whose close through the neckline is treated as a reversal hypothesis, not a finished forecast.
The neckline as the reversal statement
The left shoulder formed in mid-August as price stalled below 50. The head printed new highs in October. The right shoulder formed near the August peak after a November 15 hammer low at 45.45.
The neckline is the line across the troughs between left shoulder, head, and right shoulder. A close through it completes the pattern. Pattern completion was defined as a close through the upward-sloping neckline on December 1, with a more conservative filter of two successive closes beneath that line.
The December 1 neckline break was accompanied by heavy volume, including above-average sessions on December 1 and 2.
Light crude daily: finished head-and-shoulders and the rising neckline
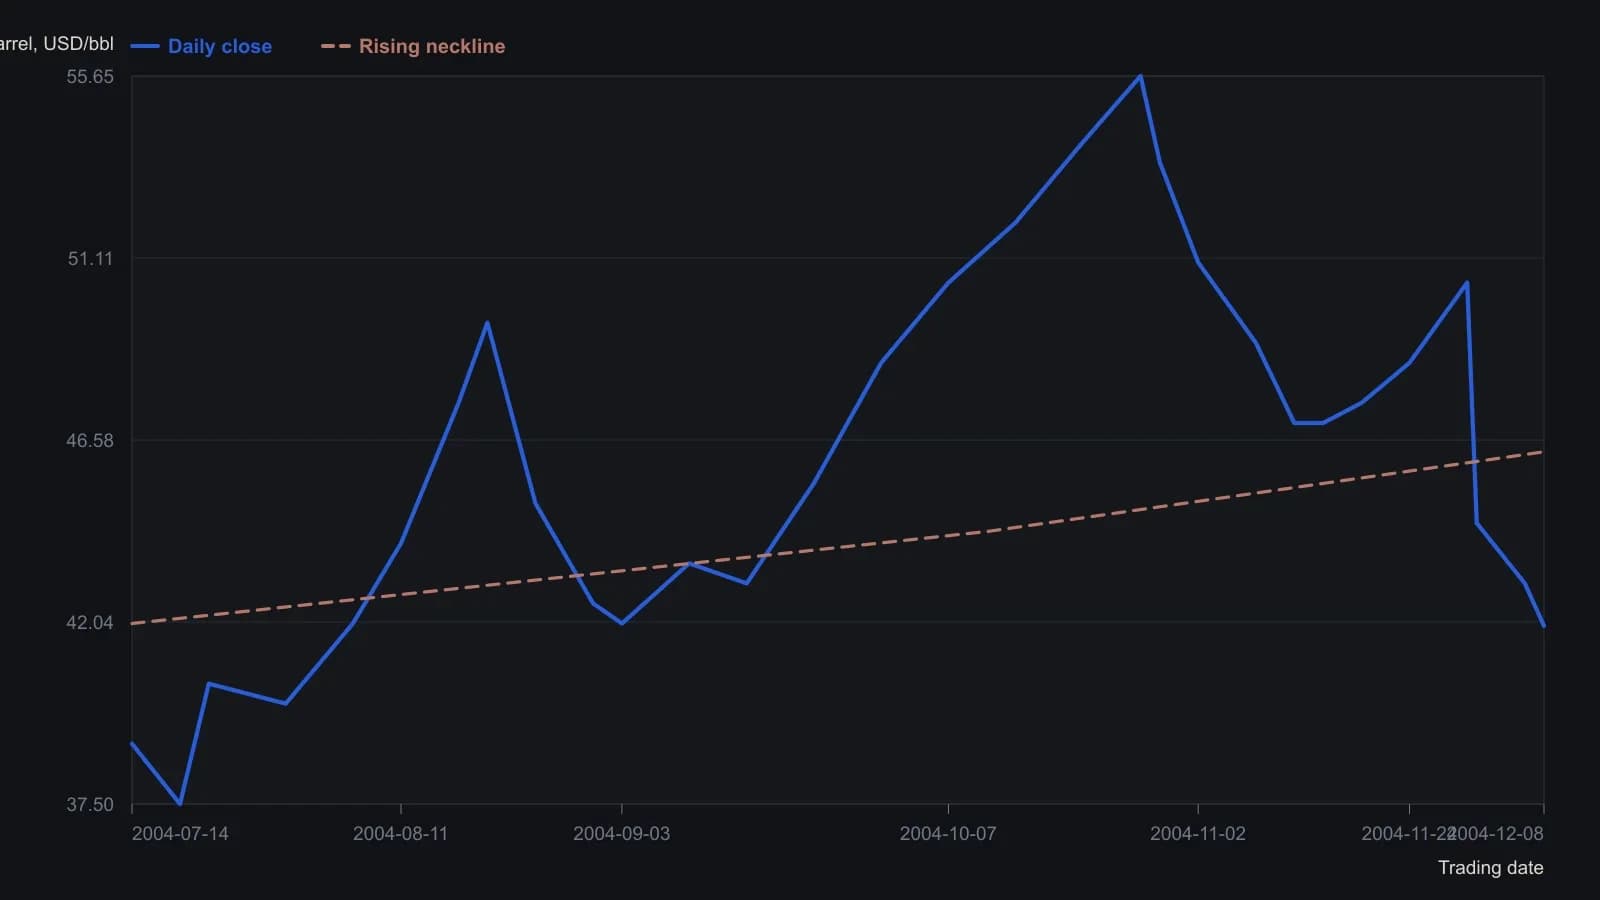
Unlabeled closes are read from the candlestick raster to the nearest half-dollar and are approximate. The 55.65 head, the 44.30 and 46.28 neckline prints, and the 8 December close of 41.94 come from the article and the chart header. The 46.28 figure is the neckline at the break, not that session's close.
Candlesticks that timed the internal turns
Candlestick patterns, in the sense used here, are two- and three-bar OHLC turns used to mark, confirm, or qualify the swings inside a larger chart formation.
Bearish engulfing printed at both shoulders: a two-candle bearish turn in which a dark candle fully covers the prior light candle. After the left-shoulder pullback, a morning star appeared: a three-candle bullish turn made of a long dark body, a small star, then a long light body that retraces deeply into the first candle.
At the October 28 head, a bearish belt-hold and reversal day marked the turn. A belt-hold is a long dark candle that opens near the session high and closes near the low. In mid-November, a hammer plus a piercing pair defended the neckline. A hammer is a candle with a long lower shadow that rejects lower prices and closes nearer the highs. A piercing pattern is a bullish two-candle turn that opens below the prior low and closes above the midpoint of the prior dark body.
A December 8 bounce opened below the prior low but failed to close above the midpoint of the prior dark body. It was treated as a piercing variation that might produce a short-term lift back toward the neckline.
The breakaway gap and a possible throwback
Gap analysis, in the sense used here, is reading an opening discontinuity at pattern completion to judge whether a throwback is still likely and when the larger structure would fail.
The December 1 gap at 45.35 was labeled a potential breakaway gap at pattern climax. A breakaway gap is a gap that opens as a major pattern completes, often on heavy volume, and may reduce the chance of an immediate return to the neckline.
Heavier volume made a fill less likely. Leaving the gap open for a week was said to increase the chance a larger move had started.
Polarity versus the raw measured move
A measured move is the vertical height from the head to the neckline, projected from the breakout to form a minimum price objective. The minimum measured-move objective of 34.93 was obtained by subtracting the 11.35 October 27 head-to-neckline distance (55.65 minus 44.30) from the December 1 break at 46.28.
Polarity is a former resistance zone that can later act as support, and that can outrank a raw measured-move number. The mid-35 area was treated as polarity support that had capped price in early 2004 and later held in April and June, so the raw 34.93 objective could be raised toward 35.50.
What would invalidate the hypothesis
Invalidation was a close above the right shoulder. That close would also clear the 0.618 retracement of the decline from October and reopen the longer-term advance.
Until then, the rising channel from early 2002 still pointed toward a lower-boundary test near the measured-move zone.
All readings on this track · 11 readings
- 1987Broken bias: stops, cash flow and unfilled gaps
- 1999A surviving weekly gap still needs a confirmation-breakout
- 2000Repeatable volume-price silhouettes as falsifiable hypotheses
- 2004Constructing pivot commonality across timeframes
- 2005A finished crude-oil top as a classroom for necklines, candles, and gaps
- 2007Journal a gap breakout as three sequential gates
- 2008Same-open kicker as a two-bar reversal case
- 2010Filtered gap follow-through entry rules
- 2010Cloudbank overhead resistance and breakout recovery
- 2015Post-exit cooldown as a system rule
- 2018Classifying chart gaps before fill or follow