2005issue C011-3
Commodity group bases, breakouts and pennants
This case study audits an energy-heavy five-group commodity composite group by group. Each chart is staged through base-building, the first decisive breakout, and later flag-and-pennant pauses, with every continuation reading tied to a pre-stated invalidation-level.
- The five-group composite was energy-dominated, with energy above 70 percent of dollar weight, so a group-by-group chart audit is required to see whether a continuation reading is shared.
- Four groups finished multi-year bases and then posted major 2002-2003 breakouts. Energy never based and was the first to break out, in 2000.
- Each later pause was given a named invalidation-level: agriculture near 175, energy near 100, livestock at 200, industrial metals at 187, precious metals at 497, and the equal-weight pennant at 262.
- A flag-and-pennant is a compact continuation test after a sharp advance. It is not a new multi-year base, and the reading lasts only while the stated floor holds.
A composite that needs a group map
The archive describes a five-group commodity composite that was energy-dominated. Energy held more than 70 percent of dollar weight, livestock more than 12 percent, and the remaining three groups together less than 16 percent.
Base-building is a long sideways range that absorbs a prior decline and later becomes the launch structure for a directional attempt. A breakout is a move through a well-mapped ceiling or falling-channel boundary that turns the prior range into a working continuation hypothesis. A flag-and-pennant is a compact, often converging pause after a sharp advance, read as a continuation test rather than a new multi-year base.
The editorial task is not to score the composite as a single line. It is to stage each group through those three conditions, then keep every continuation reading tied to a pre-stated invalidation-level so breadth can be checked group by group.
Goldman Sachs Commodity Index monthly, 1996–2005
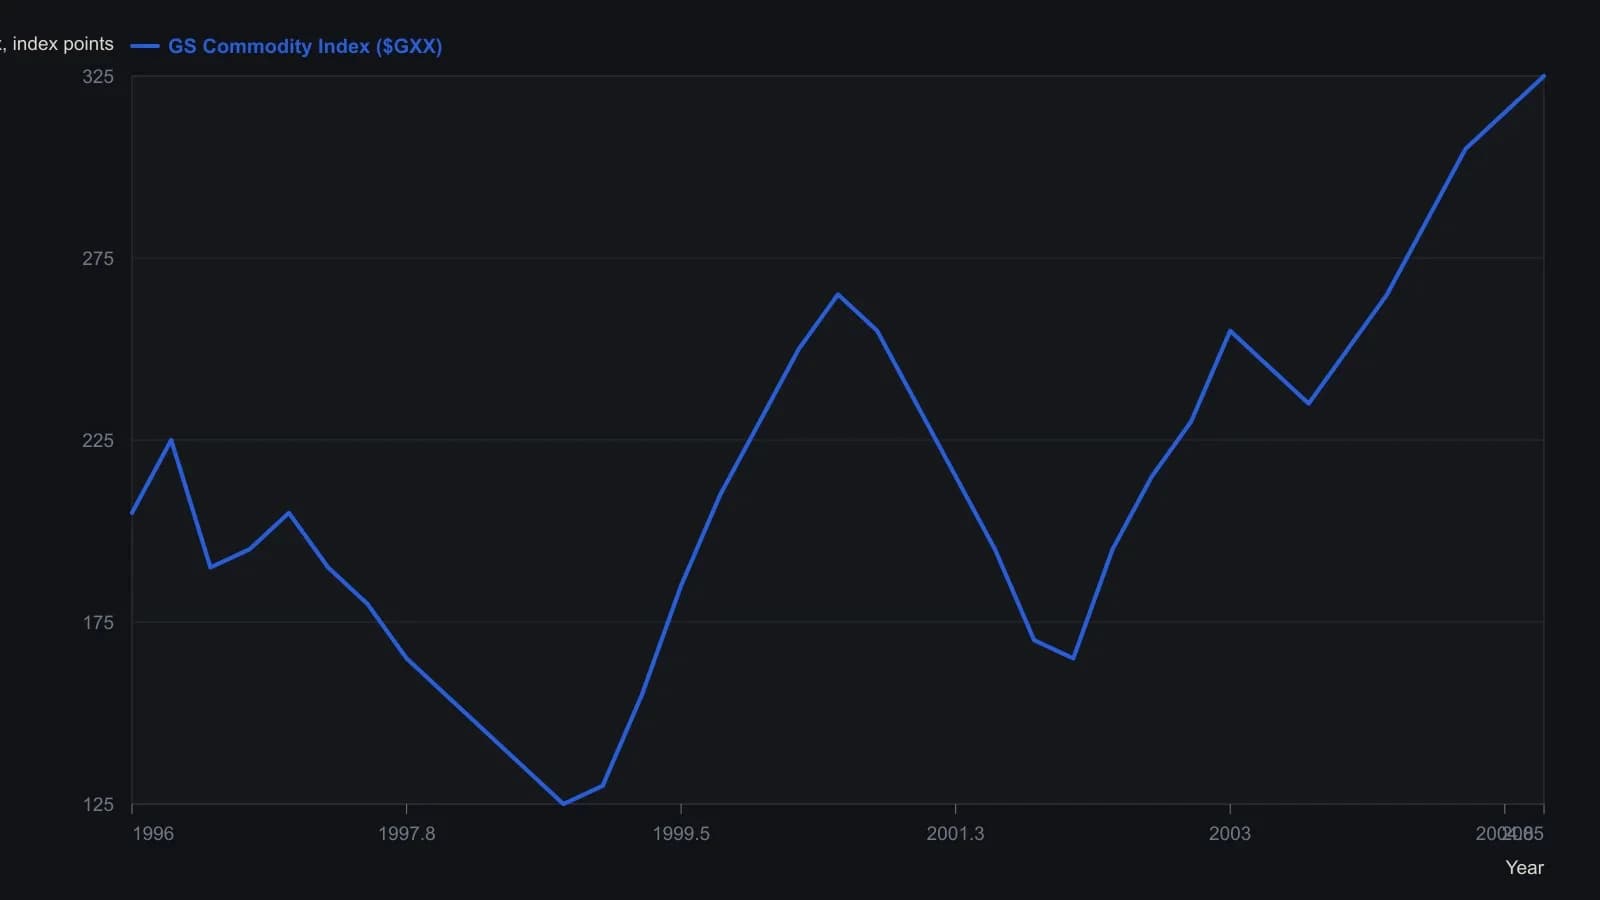
Closes estimated from the monthly bars; channel and horizontal overlays were not digitized. Rounding is to the nearest 5 index points because the raster does not support finer precision.
Four bases and one group that never based
Four of the five groups completed multi-year bases: agriculture from 1999 to 2002, industrial metals from 1998 to 2003, precious metals from 1997 to 2002, and livestock from 1996 to 2003. Energy never based and was the first to break out, in 2000.
Four groups then posted major breakouts in 2002 to 2003. By the review, only agriculture had returned to its breakout zone. That is the first breadth split on the map: one group was back at broken-resistance-support while the others were still being read as intact advances or compact pauses.
Agriculture, energy and livestock
The agriculture group showed a three-year base and a breakout through 200, then retreated toward former resistance near 180. That retreat is the first broken-resistance-support test. The 2003 lows around 175 were treated as the line that would keep the decline a throwback rather than a failed breakout.
The energy group printed new highs in early 2003 and again in summer 2004. Nearby support was marked at 134 from a rising trendline and former resistance. A move below about 100 was specified as the invalidation-level for the long-term uptrend reading.
The livestock group cleared a major resistance zone in 2003, reached a multiyear high, then pulled back inside two rising channels whose upper lines met near 240. That pullback was treated as consolidation unless price lost 200.
Industrial metals and precious metals
Industrial metals built a large 1998-2003 base, broke 175 late in 2003, and pushed through 200 in 2004, then coiled in a pennant. A print above the July high of 215 was the continuation trigger. A drop below the 2004 low of 187 opened a deeper pullback.
Precious metals spent 1997 to 2002 in a large base described as a double bottom, then broke 450 with a measured-move objective near 550. A measured-move is a first objective projected from the base, not a guaranteed destination. After that zone was reached, the range was treated as consolidation so long as the 2004 low at 497 held.
An equal-weight basket as a breadth check
A more equally weighted 17-name commodity basket, unlike the energy-heavy composite, escaped a multi-decade falling channel with a 2003 thrust to a 20-year high. That channel exit is the same breakout idea used on the group ceilings: a mapped boundary that turns the prior range into a working continuation hypothesis.
The basket then spent most of 2004 in a pennant. 286 was the upside continuation line and 262 the pennant floor, with a deeper correction still mapped toward 230-250. The pennant is the flag-and-pennant test on this second map, and 262 is the invalidation-level that keeps the pause from being rewritten as a new base.
Editorial reading of the group map
An editorial interpretation, not an archive claim, is that the energy-heavy dollar weights make a single composite line a poor stand-in for breadth. Energy can carry the index while agriculture is still working a throwback, or while industrial metals and the equal-weight basket are still inside a flag-and-pennant pause.
The equal-weight basket is useful as a second map because its 2003 channel breakout and 2004 pennant are not the same sequence as the energy-dominated composite. The method does not become a price forecast. It only keeps each group's continuation hypothesis falsifiable at a named invalidation-level.
All readings on this track · 17 readings
- 1994Cup-and-handle base construction and volume breakout
- 1996Constructing a mobility oscillator from price distributions
- 1996Float turnover as a construction rule for bases and breakouts
- 2001A historically derived growth checklist for entry, exit, and staying out
- 2003Base-building then breakout after a market bottom
- 2005Commodity group bases, breakouts and pennants
- 2005Logic-first construction of a base-break system
- 2005Quiet bases copied onto an intradacy clock
- 2005Failed cup-with-handle after earnings and float filters
- 2006Turning flat bases into breakout system rules
- 2007Base-building holds versus swing timing
- 2007Confirmed index highs, style-fit trend systems, and bases
- 2007Name the sideways regime before you test the breakout
- 2011A three-peaks-and-a-domed-house chart is not a complete timing model
- 2014Constructing a volume-capacity channel from a sideways base
- 2016Waves, bases, and the campaign log on a price chart
- 2020Ratio charts as regime context for relative strength and yield spreads